The US dollar was seen falling slightly on the day. Economic data showed the release of the German final GDP data for the first quarter. The quarterly pace of GDP was seen rising 0.3%, unchanged from the previous estimates.
Retail sales from the UK showed an increase of 1.6% on the month. This was higher than the forecast of 0.8%. The previous month's data was also revised to show a decline of 1.1% which was slightly better than the initial estimates.
The ECB released its meeting minutes which showed that officials were concerns that the slowdown would continue further than expected.
Economic data for the day will see the release of the second GDP estimates for the first quarter. Median forecasts estimate that the first quarter GDP remained unchanged at 0.1%. Later in the day, the U.S. trading session is expected to see the release of core durable goods orders. Forecasts point to a 0.5% increase. However, the headline durable goods orders are expected to fall 1.3%, declining almost half from the gains made in March.
The BoE Governor Mark Carney and Fed Chair Jerome Powell are expected to speak later in the day.
EUR/USD intra-day analysis

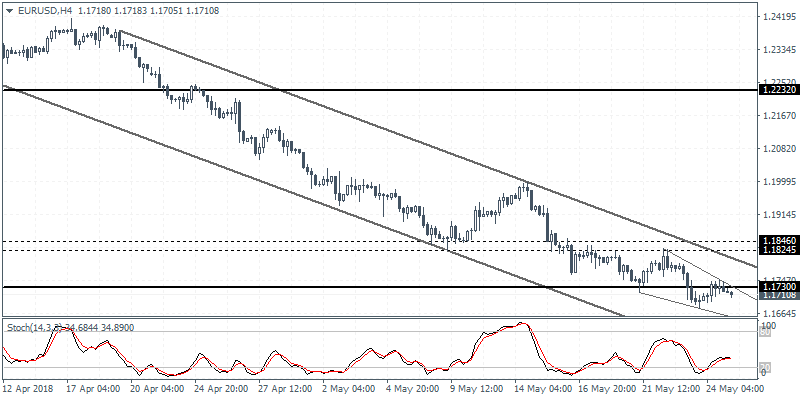
EUR/USD (1.1710):The EUR/USD was trading within Wednesday's range as price action attempted to post intraday gains before pulling back lower. The EUR/USD briefly tested 1.1730 level before easing back. The inside bar formation could trigger a near term breakout off Wednesday's highs and lows. On the 4-hour chart, price action continues to remain in a consolidation mode that is now shaping out into a descending wedge pattern. An upside breakout could trigger a move toward 1.1846 - 1.1824 level of resistance.
USD/JPY intra-day analysis

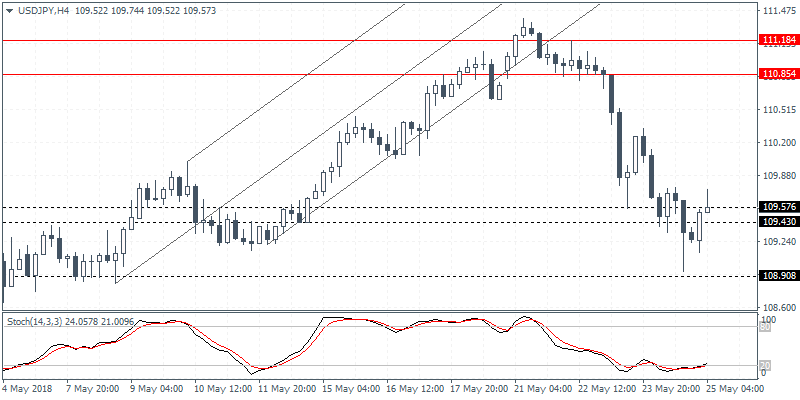
USDJPY (109.57): The USD/JPY broke down below the support level of 109.57 - 109.43 as price action fell just a few pips above the next main support at 109.90. The rebound off this level saw prices retesting this support level which is likely to act as support. In the near term, we expect to see USD/JPY most likely to decline back for a firm retest of support at 108.90. To the upside, in the event of a breakout above the support/resistance level, then we can expect further gains to push USD/JPY back to 110.85 level of resistance.
XAU/USD intra-day analysis

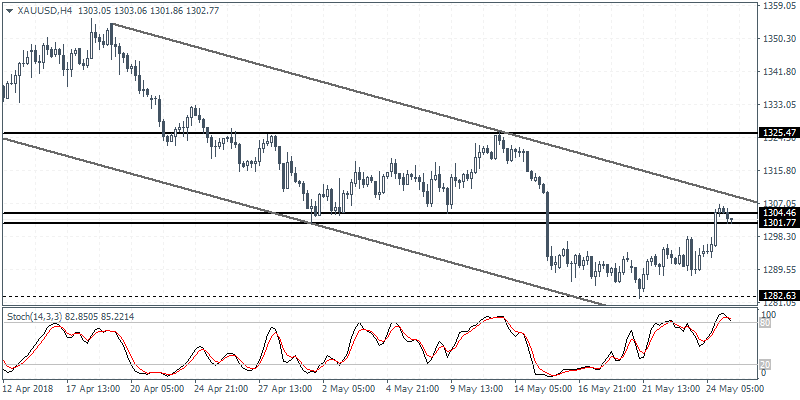
XAU/USD (1302.77): Gold prices posted some modest gains as price action managed to touch the resistance level near 1304 - 1301 level. Price action is required to breakout above this resistance level in order to post further gains. The next main target to the upside will be at 1325 level. To the downside if price slip below the resistance, then we expect to see further consolidating taking place within 1304 - 1301 level and 1282 support.
