The US dollar was seen trading mixed yesterday. Economic data was sparse for the day. The UK’s public sector net borrowing data showed that government borrowing fell to the lowest levels in a decade. The deficit dropped by 1.6 billion GBP on a year over year basis in April to 7.8 billion GBP.
Earlier in the day, the core CPI data from the Bank of Japan showed that core inflation rate increased at a slower pace of just 0.5% on a year over year basis in April. This was below estimates of a 0.6% increase and slower than March’s increase of 0.7%.
Looking ahead the economic data for the day will see the release of the UK's inflation data. Economists forecast that UK's consumer prices rose at a pace of 2.5% on an annualized basis in April. This marks the same pace of gains seen the month before. Core inflation rate is forecast to rise at a much slower pace of 2.2% on an annualized basis in April compared to 2.3% increase the month before.
The NY trading session will see the release of Markit's flash manufacturing and services PMI. The main highlight of the day will of course be the FOMC meeting minutes which will be released closer to the evening.
EUR/USD intraday analysis

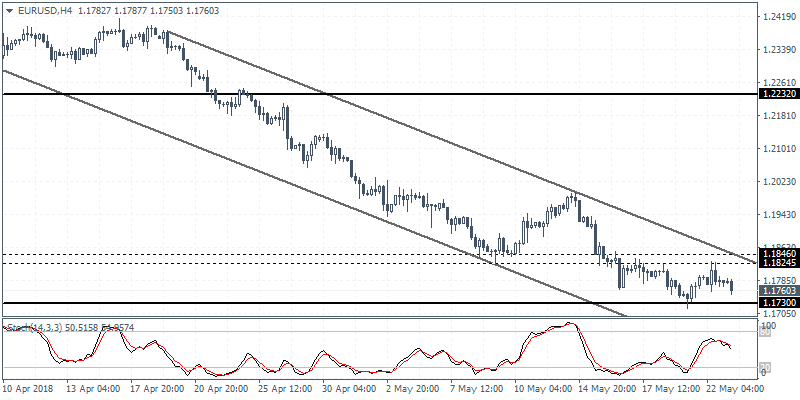
EUR/USD (1.1760): The EUR/USD currency pair was seen giving up the intraday gains to close bearish once again. However, price action remains supported above the support level of 1.1730 for the moment. We expect to see another retest to the support level at 1.1730 following which there is a possibility for the EUR/USD to push higher. Price action will need to break the short term resistance of 1.1846 - 1.1824 level in order to confirm the upside correction. In the event of a break down below 1.1730, we expect to see further losses to set in.
USD/JPY intraday analysis

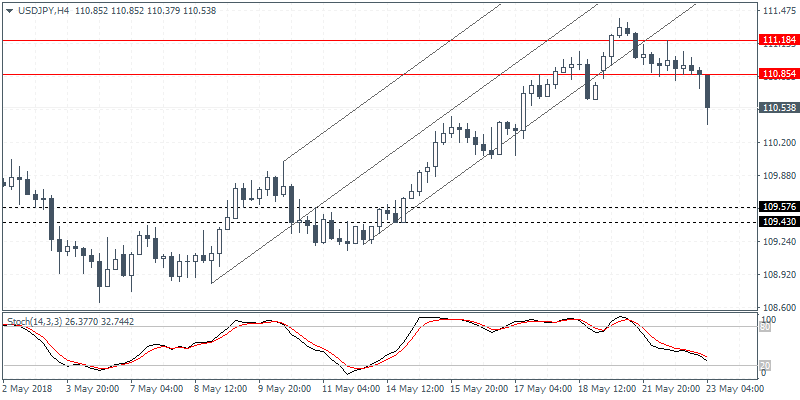
USD/JPY (110.53): The USD/JPY currency pair was seen posting losses on the day after price action recently broke past the support level at 110.85. The declines come following price action reach the resistance level near 111.18 - 110.85 levels. In the near term, we expect USD/JPY to retrace the declines back to 110.85 level following which we expect further declines. The lower support at 109.57 - 109.43 is the most likely choice of target to the downside.
XAU/USD intraday analysis

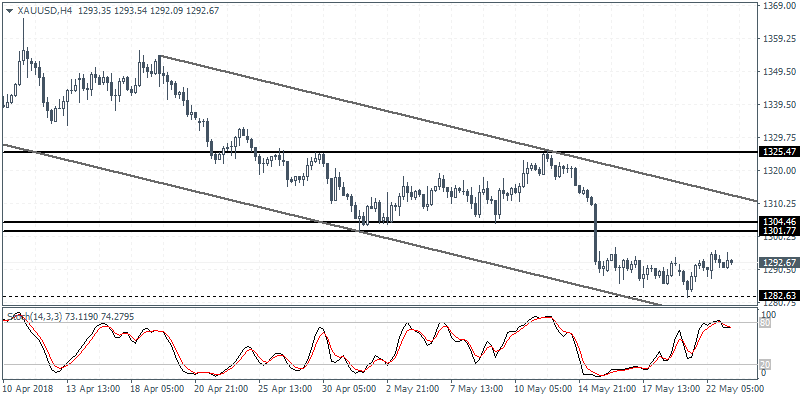
XAU/USD (1292.67): Gold prices continued to consolidate following the break down to the support level at 1282. We expect some near term declines to push gold prices a few pips lower back to this support level. In the event of a higher low being formed at the current levels, then gold prices could remain trading within the range of 1304 - 1301 level of resistance and 1282 level of support. This sideways range is expected to be maintained in the near term. In the event of a break down below 1282, then gold prices could be seen testing the next support at 1250.00.
