The economic calendar yesterday was dominated by flash PMI numbers from the Eurozone, all of which broadly showed that economic momentum in the region continued to gather pace. However, the positive streak of data did little to help the EUR/USD which fell to a 4-day low and within a few pips reach from 1.0500.
U.S. equity markets continued to climb to record highs yesterday with oil prices adding to the bounce as OPEC said that it was committed to its deal of reducing output. The renewed optimism on rate hikes along with increasing appetite for risk assets sent bond yields and gold prices modestly lower on the day.
Looking ahead, the economic calendar today will see the second estimates for the UK's GDP being released by the Office for national statistics. The ONS is expected to show no change to the Q4 GDP, which stands at 0.6%. Later in the afternoon, investors will be waiting for the release of the FOMC meeting minutes.
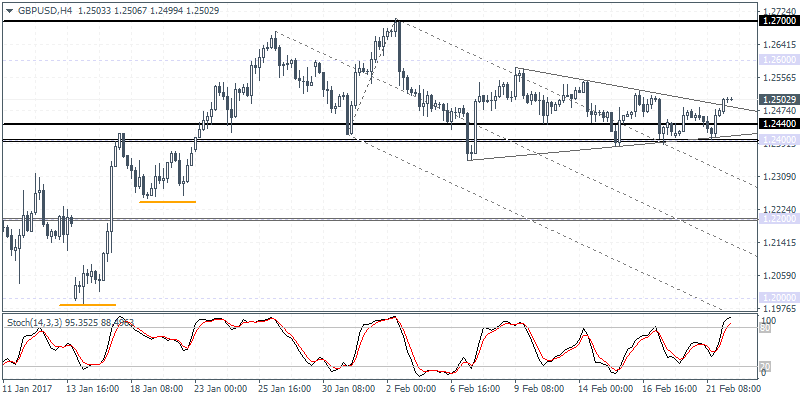
GBP/USD intra-day analysis

GBP/USD (1.2502):GBP/USD has been repeatedly consolidating near the 1.2400 - 1.2440 handle but the recent break out to the upside from here and from the triangle pattern indicates a continuation to the upside, with the next target seen at 1.2600. However, failure to rally towards 1.2600 and a continued consolidation below this level could increase the likelihood of a breakdown below the support level at 1.2400 and could invalidated the bullish outlook. The currency can be at risk today with the UK's Office for national statistics set to release its second revision on the fourth quarter GDP numbers.
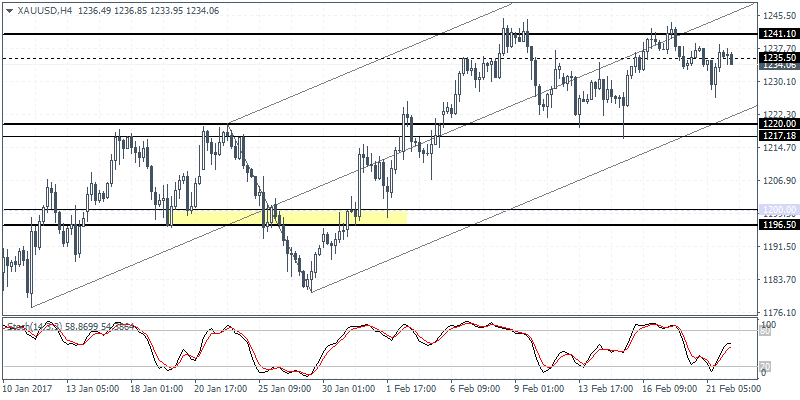
XAU/USD intra-dayanalysis

XAU/USD (1234.06):Gold prices were particularly choppy in yesterday's trading as the precious metal was seen trading weak for the most part of the day, only to reverse loses and post a strong gain towards the U.S. trading session. Still, the outlook for gold remains to the downside with $1220.00 being the first target to the downside, en route to $1200.00. On the 4-hour chart, despite yesterday's surprise pullback to the declines, gold prices have failed to break out above $1240 which could see a continuation to the downside with the FOMC likely to be the catalyst in the short term.
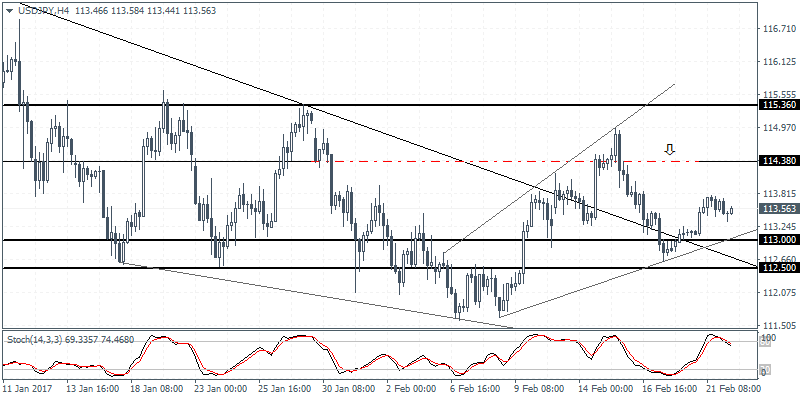
USD/JPY intra-day analysis

USD/JPY (113.56):USD/JPY managed to maintain gains to the upside following the breakout from the falling trend line. Price action is now a few pips below testing the resistance at 114.00 which previously held up pushing prices to the lows near 112.80. With the upside breakout from the inside bar, USD/JPY will need to make a bullish close above 114.00 to confirm further upside in prices. The resistance level of 114.00 - 114.38 will be one to watch as the broadening wedge pattern within which USD/JPY is trading in could signal a potential reversal back to 113.00.
