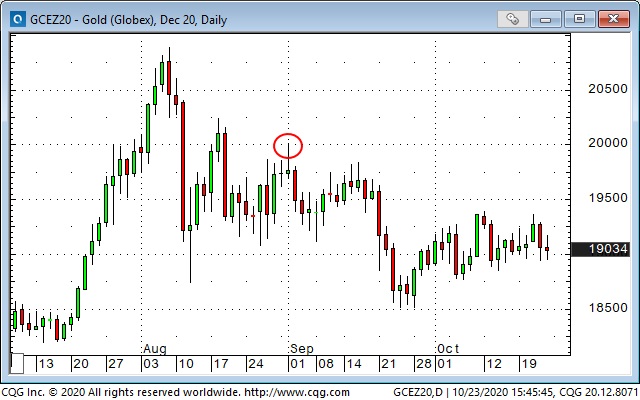
One of my basic risk management trading principles is to keep the time frame of my trading in sync with the time frame of my analysis. To do otherwise can easily lead to BIG losses.
For instance, if I buy gold because my “analysis” is that I think it could jump $10 today I don’t want to find myself still holding that position a month from now with gold down $100 because I’ve changed my “analysis” to believe that gold is in a multi-year uptrend.
If my original analysis had been that gold was in a multi-year uptrend I might have waited for a good setup to get long gold and I would have sized my position in keeping with my risk tolerance.
Over the past 6-week time frame, my analysis has been that the major U.S. stock indices, and the Nasdaq 100 in particular, may have had a “blow-off” top in early September (I’ve called that a Key Turn Date) after a spectacular rally from the March lows.
There were at least two “poster child” events that illustrated the extreme bullish sentiment at the end of August. One was the sharp increase in the share price of both Apple (NASDAQ:AAPL) and Tesla (NASDAQ:TSLA) simply because they were doing a share split. (The split shares of both companies began trading August 31.) The other event was massive retail buying of short-dated OTM call options – “lottery tickets” as the floor brokers used to call them!
The major stock indices sold off from early September into late September and then rallied back to make a “lower high” around Oct 12 – 13. This “lower high” creates one of my favorite chart patterns…the double top with a lower right shoulder.
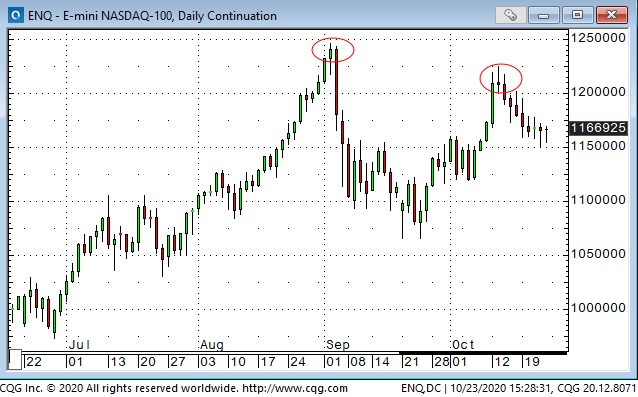
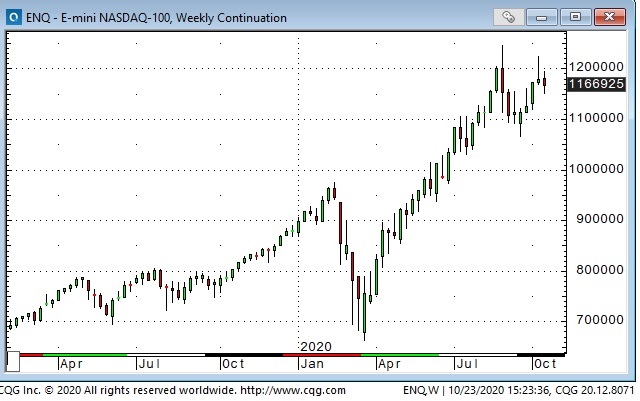
I shorted NASDAQ Futures as prices began to fall away from the double top…thinking that if the market fell through the early October lows then the September lows would be the next target. If the market finds support around current levels and rallies back I will be stopped out with a small profit. (I lowered my stop as the market fell.) If the market continues lower I will try to add to my short position. The weekly chart gives some perspective on the rally since March and the amount this market could fall if we really did see a double top.
One last thought on the equity markets…what really seems to be happening is “rotation” away from the tech stocks that have been the leading lights since the March lows (and for the past couple of years) and into other stocks (for instance, the Transports are at all-time highs…small cap indices are strong.) I don’t know if this rotation is prudent rebalancing or pre-positioning ahead of a possible Biden win…or both.
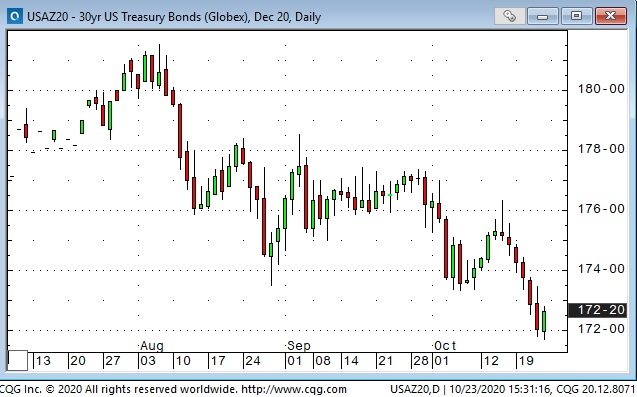
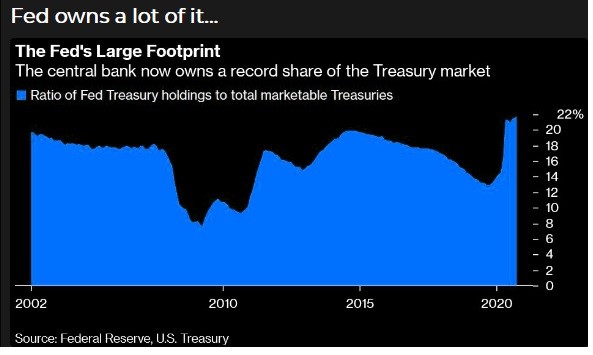
Bond yields have been rising and the yield curve has been steepening the past three months (bank shares like a steeper curve.) Perhaps the prospect of massive issuance to finance unlimited government spending/stimulus is pressuring bond prices (bond yields up = prices down.) Perhaps the bond vigilantes are testing the Fed…perhaps the Fed doesn’t mind higher long term yields on the way to the 2+% inflation that say they want. The Fed already owns 22% of outstanding Treasuries…
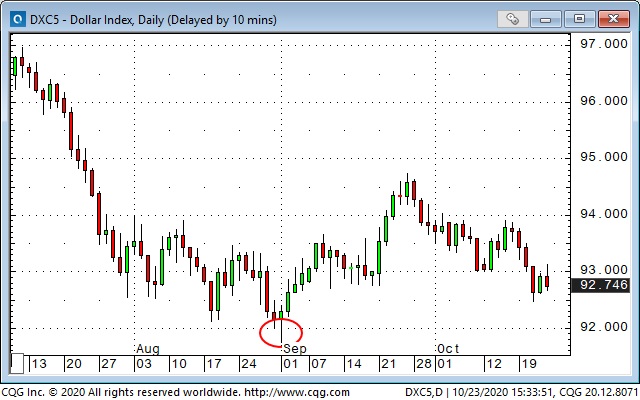
The US Dollar Index reversed off a 28 month low on the September KTD. If risk sentiment reversed on the KTD after a giddy run-for-the-roses this summer then capital may well have sought the relative “safety” of the USD. But the USD rally petered out in late September and it’s drifted lower against most currencies the past few weeks. I had shorted both EUR and CAD looking for the USD rally to continue but was stopped for a breakeven early this week on those positions.
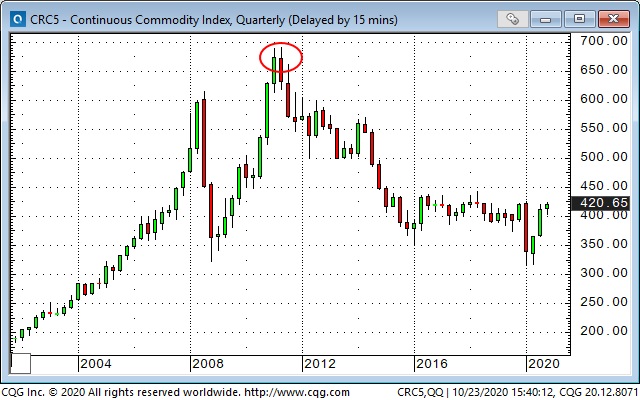
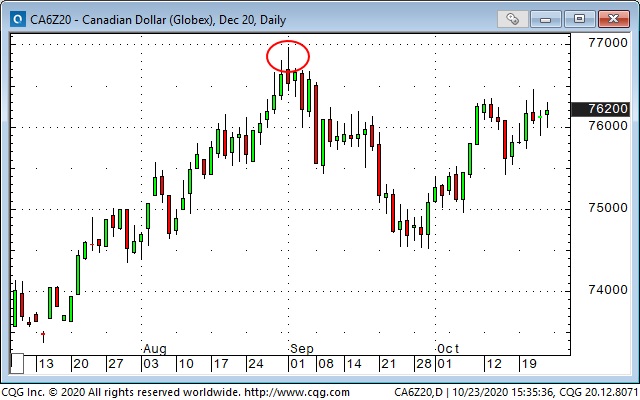
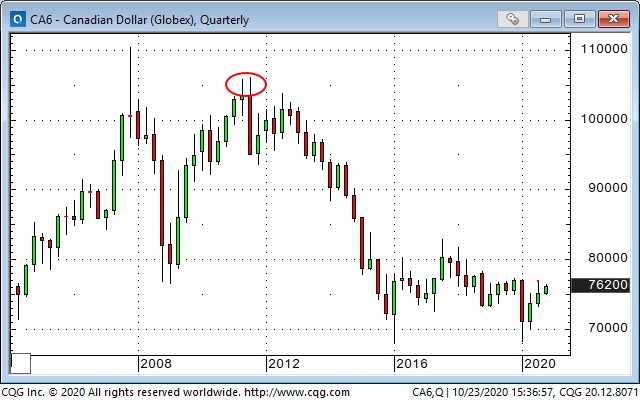
The Canadian Dollar hit a 4 year low around 68 cents in March and rallied to a high of 77 cents on the September KTD (77 cents has been a lid on CAD for the past 2 years.) CAD has rallied the past 4 weeks as the USD has weakened and is now in a very interesting position. If it rolls over here it would create a double top…if it rallies through the 77 cent level it could be seen as a bullish breakout. The CAD has a historical correlation with commodity indices which have trended lower since 2011…when CAD hit a high of 1.05. If commodities are going higher then CAD might also rally.
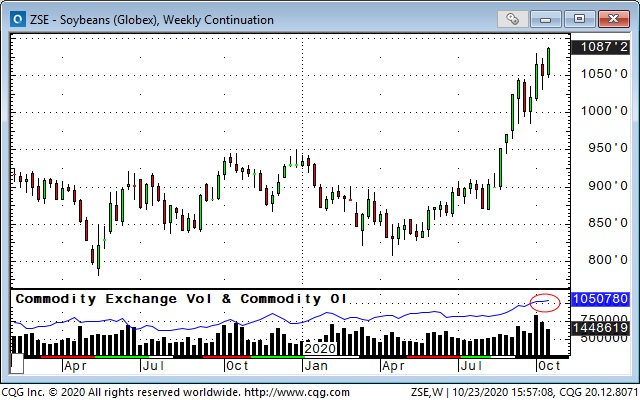
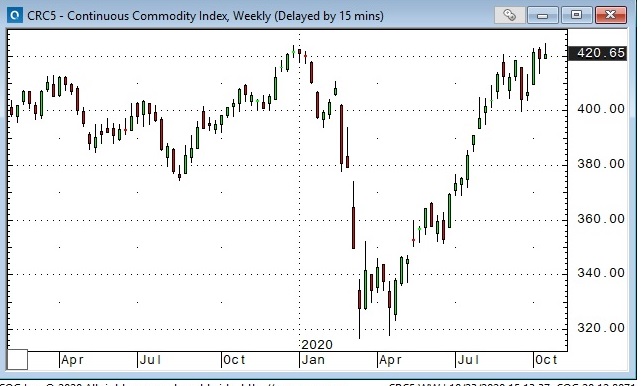
The broad commodity indices are back near their high for the year (while WTI crude oil struggles around $40) as grains, cotton and copper have rallied hard off their March lows. Soybean futures open interest is at all-time highs at over 1 million contracts.
