Micron surges after one of the biggest beats in U.S. semis history
Asian equity markets have been in bullish mood again, following through with the solid bid seen yesterday. Indeed, China has been at the heart of the move as traders gear towards next week's China annual policy conference, and the idea of further easing at a fiscal level is set to spur consumption.
The ASX 200 is underperforming (currently +0.3%). However, we can see the price pushing above the 5-day EMA, with a momentum crossover seen in the oscillators suggesting an elevated probability of pushing into 5775/80 in the short-term. Again, volume has been above average, with reasonable participation, where 62% of stocks are higher on the day. So, there are some signs of green shoots, but let’s not forget the primary trend is still headed lower and the index is still trading firmly below any of the medium-, or longer-term averages.
The Nikkei 225 looks interesting too with the daily chart showing a clear double bottom into 21,000. The momentum studies are now headed higher and the price is now subsequently testing the 50% level of the 7.2% sell-off seen between 3 December and 11 December. The weekly chart gives me no confidence to hold longs, but the daily (and four-hour) chart suggests that we are getting closer to a buy for a move back into the top of the range of 22,500. This is one that I will be keeping an eye on, as is the case in China, where volumes are picking up.
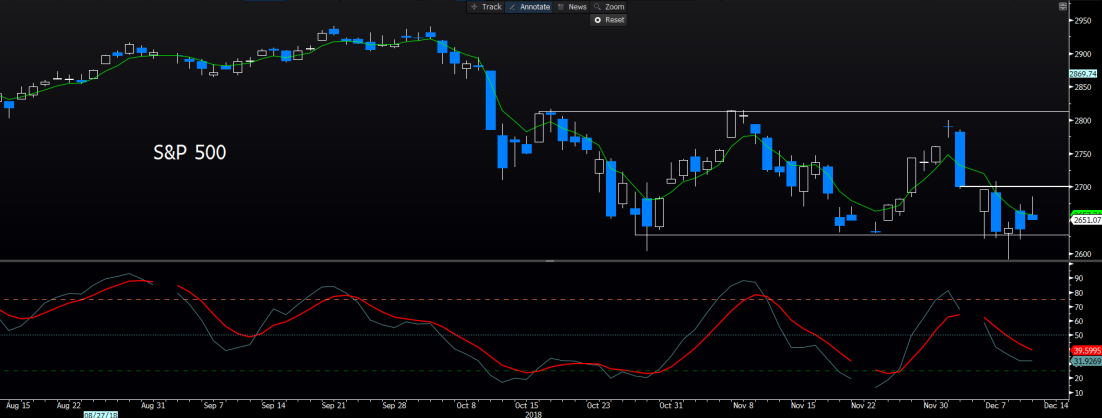
As I laid out yesterday, it’s the S&P 500 that defines the central bias on global equities, and I remain transfixed on the 2702 level, where a close through here would again suggest an elevated risk of a move into the top of its range around 2800. Overlap a chart of the Nikkei 225 here, and I’d argue if we trade the S&P 500, we may as well trade Japan, so it’s a question of time zone. Of course, the downside on the S&P 500 needs monitoring too, where we have seen huge support between 2630 to 2600. Should this give way (on a closing basis) and should there be a few brave souls off-side, they would be forced to cover, and global equities would be headed for a pretty miserable end to the year. We shall see, but if the S&P 500 is my guide, then a close through 2702 and 2630 must be noted.

In FX markets, arguably, it’s all eyes on the EUR ahead of tonight’s ECB meeting at 23:45 AEDT. The playbook is diverse, and one could make a case for upside and downside risk to the EUR. One factor I like to look at is the implied volatility in EUR/USD overnight options, and here we see an expected move of 74-points on the session ahead. For those looking for a higher probability outcome, then it is fitting to see this implied move testing the upper and lower Bollinger Band® on the daily chart. When the 20-day MA headed perfectly sideways (as is the five-day MA) is married with the 14-day RSI hitting exactly 50, this is about as perfect a range trading condition that you will see. That said, if there is a weekly close through 1.1456, my neutral view will shift and I will go long.
It seems clear Draghi will put a formal end to its QE program and not out of want, but because the central bank has run out of bonds to buy. There will be tweaks to the bank's economic data forecasts, but nothing that should rock the boat too greatly. However, it’s the language around the economy that the market will key off, and just how confident they are that the recent weakness in the data flow is truly transitory. With Friday’s PMI data and IFO survey due next week, these data points should reveal whether the core of Europe is due to bounce back in Q4, or if we could feasibly use the word ‘recession’ more liberally when Germany report Q4 GDP on 14 February. After a contraction of 0.2% in Q3, the market expects 0.5% growth in Q4, but it feels like this is perhaps a touch too high – the aforementioned data should go some way to back that view.
While all eyes on EUR/USD, a trade I am eyeing is long EUR/NZD, but specifically, on a move through 1.6592, then I will go long smalls. The 1.6766/88 area is obvious and significant resistance, so I expect supply to kick in here, but a break here and its on. This is why the preference is to start with a small exposure, and as the trade heads in the right direction, it pays to add. As in life, if something works, you do more of it and cut back and do less of what doesn’t work.
GBP has predictably seen good flow, although it was in the twilight hour, and between the U.S. close Asia open traders went to town on GBP/USD and the GBP crossed. The wash-up is Theresa May gets another 12 months at the helm, and that removes much of the hard-Brexit chatter that had been prevalent. That said, 117 MPs voting against May’s on-going leadership will disappoint, and make it almost impossible to pass the current proposal, unless we hear definitive changes from the EU that they will move heaven and earth to avoid using the backstop, and specifically, these terms need to be legally binding. The probability of that is just so low, and the EU is pushing the UK into a binary outcome. They pull out of Brexit, either through a second referendum or rescinding Article 50, or, they crash out of the union with no formal deal, which few MPs want. GBP/USD has been offered into the 4 December low, and this needs monitoring as I can easily see the pair giving back much of the overnight rally. The door is slightly open for a Norway+ model, and that would have positive implications for GBP, but this model would have it's critics.
AUD/USD looks interesting from the long side, with price pushing up from the failed break of the late November lows. Granted, buyers are seen in Hong Kong and China, but there has also been some focus on USD funding markets, and we see AUD cross-currency basis swaps at +41bp – the highest levels since July, which, in itself, is one of the highest levels ever. The demand for USD funding is low, and this is positive for the pair. Of course, the domestic economy has its vulnerabilities, and these concerns are all well documented. We have seen this reflected in the rate's market, with a 10% chance of a cut by mid-year. So, buying AUD is tough, and timeframe is the obvious criteria.
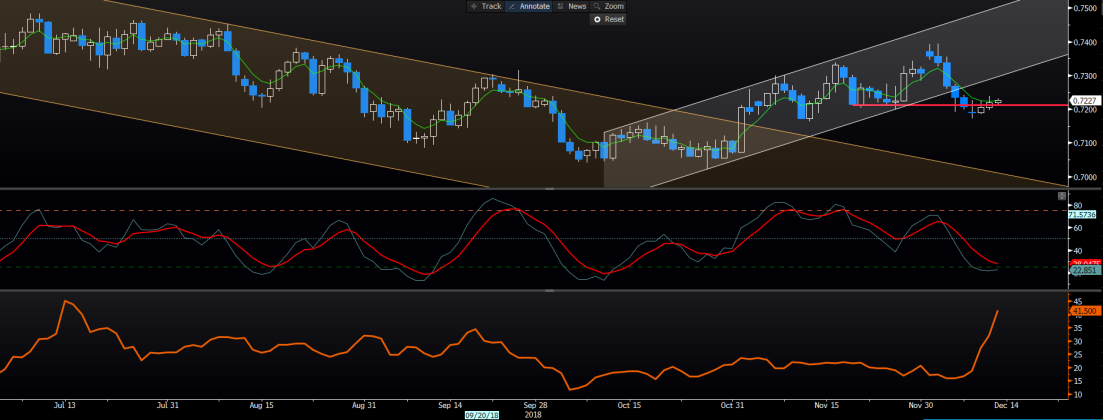
On the daily chart, we can see the price pushing above the 5-day EMA and printing its fourth consecutive lower high. Momentum is eyeing a bullish crossover, and the odds of a move into 73c are rising. GBP/AUD is another on the radar, where we can see sellers easy to come by into 1.7500. The GBP bears could look for shorts here, closing on a move through 1.7500.

