Market carnage
The ASX’s positive print yesterday looks like being an aberration as the carnage in global markets overnight leads me to one thought – capital preservation.
What’s catching my attention in the AM
DOW has now lost 7.31% year-to-date, S&P has lost 7.52% over the same period, the VIX added 12% overnight up 30% YTD to 24.7, and finally the biggest indicator – the volume through the US markets was 40% above the 100-day moving average. This move is real.
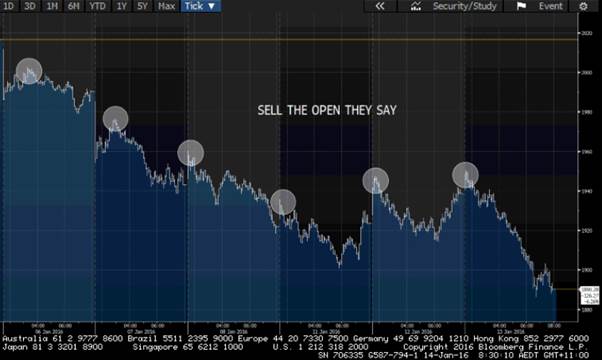
Interestingly, the S&P chart is currently telling a very interesting trade idea trend on the open.

Another bearish sign new lows in the US yield curves and the credit markets getting hammered. The US yield curve is now the flattest it’s been since 2008. Ten- and five-year treasuries were bid up strongly last night.
The Russell 2000 is now in a bear market, having lost 21% since the June record high. Small cap risk is clearly too high.
Staying in the US small cap space – the US Powerball winning pot is now larger than the total of the market caps of over half the listed energy firms on the Russell 2000.
The selloff in oil signalled once again the risk-off trade – Brent lost all of its recent rally and fell below $30 a barrel again for the first time since 2004 and settled at US$30.43.
· The EIA released a forecast paper overnight suggesting the global oil glut will actually swell over the coming 18 months and will begin to moderate in the second half of 2017.
Iron ore dropped back below US$40 a tonne and has now declined for a seventh straight session to US439.51. N:BHP has lost 17.3% in 2016 as crude and iron ore prices create a jaws effect on earnings expectations – it’s at its lowest level in 12.5 years and no price floor has materialised yet.
The end of the China session is also a concern, the CSI 300 and the Shanghai Composite crash in the final hour of trade yesterday to finish down over 2.5% despite stronger than expected trade balance data. Interestingly, over 533 stocks in China are now in the oversold territory of the RSI indicator.
The Chinese trade balance did show that China recorded an iron ore import figure of 96.3 million tonnes a record print and is up 17.2% month-on-month. However, the price value for December flat-lined as the collapse in price continues to squeeze margins.
AUD is back below 70 cents to 69.56. two things to watch today around the AUD, China fix and the Australian employment numbers today. Expectations are for the unemployment rate to rise to 5.9% from 5.8%. However, it’s likely the November number will be revised up slightly. What would be interesting is a negative fix and a negative employment read – it could send the AUD to low-69 cent levels and even into 68 cents.
Ahead of the Australian open
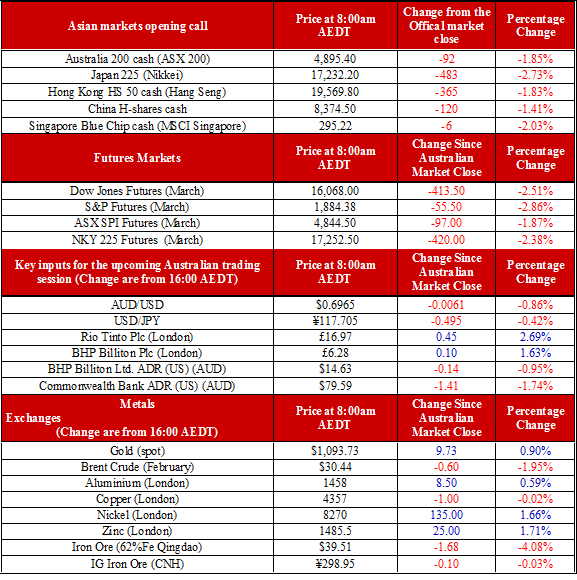
Ahead of the open, we are calling the ASX down 92 points to 4895, a -1.85% change. This would be the lowest level on the ASX since July 2013 – keep your stops close.

