Highlights
- Market Movers: Weekly Technical Outlook
- NFP paves the way for a Fed rate hike in December
- Look Ahead: Stocks
- Look Ahead: Commodities
- Global Data Highlights
Market Movers: Weekly Technical Outlook
Technical Developments:
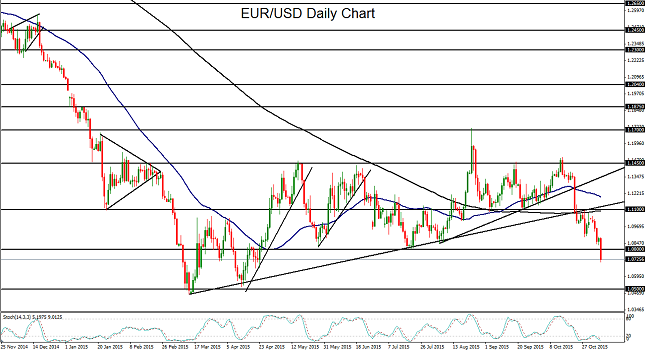
- EUR/USD has hit our 1.0800 downside support target and continues to be pressured towards 1.0500 by a strong US dollar after a much better-than-expected US employment report. Technical bias: Strongly bearish
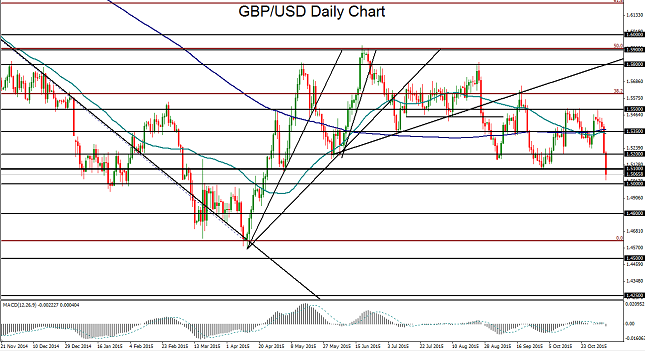
- GBP/USD reached down to hit a new six month low after the US Non-Farm Payrolls report, and could continue to see downside below 1.5000. Technical bias: Bearish
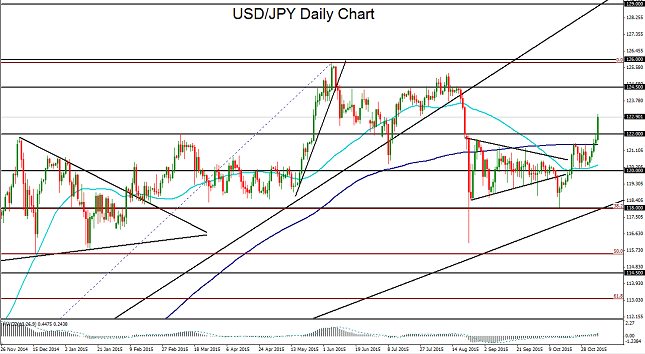
- USD/JPY broke out above key 122.00 resistance and continues to benefit from renewed expectations of a December Fed rate hike. Technical bias: Moderately bullish
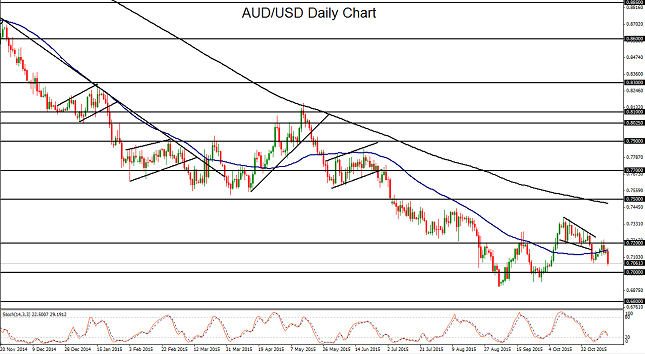
- AUD/USD remains pressured below 0.7200, and should see further downside in light of divergent monetary policy between the RBA and Fed. Technical bias: Strongly bearish
EUR/USD
EUR/USD has spent the past week trading well under key 1.1100 resistance and dropping towards its 1.0800 initial downside support target. The US Non-Farm Payrolls report on Friday, which showed a much better-than-expected number of jobs added for October, prompted the dollar to surge and the EUR/USD to plunge well below that 1.0800 target. This resumption of the bearish bias occurs after the currency pair broke down two weeks ago below a confluence of support at the noted 1.1100 level, the 200-day moving average, and a well-defined uptrend support line extending back to March’s 12-year low. After that breakdown, EUR/USD has respected that confluence of previous support factors, but now as resistance. With the 1.0800 downside support level now broken down, the outlook for EUR/USD has reverted once again to strongly bearish. If the currency pair sustains its breakdown below 1.0800, downside momentum could further pressure the currency pair towards its next major support target at 1.0500, which is the area of March’s multi-year lows.
Source: FOREX.com
GBP/USD
GBP/USD plunged this past week from major resistance around the 1.5500 level down to its 1.5200 initial downside support target. In the process, price action broke down below key support around 1.5350, as well as both the 200-day and 50-day moving averages. After the US Non-Farm Payrolls report was released on Friday, a strengthened dollar prompted a further plunge for GBP/USD below its 1.5100 support target, where the currency pair bottomed out in early October, to approach the 1.5000 psychological support level. With this week’s dramatic slide, GBP/USD has strongly reasserted its bearish bias, especially in light of a relatively dovish Bank of England in contrast with a relatively hawkish US Federal Reserve. The next major target immediately to the downside is at the noted 1.5000 psychological level. With any break down below 1.5000, the next major downside target is at the 1.4800 support level.
Source: FOREX.com
USD/JPY
USD/JPY rose sharply this past week on a rebound in the US dollar and lack of significant volatility in the equity markets. In the process, the currency pair broke out above its previous trading range between the 200-day and 50-day moving averages, and rose up to test major resistance around the 122.00 level. This rise was caused largely by increased speculation over a December rate hike by the Fed. The US Non-Farm Payrolls report on Friday prompted a forceful breakout above 122.00, reaching up to the 123.00 handle. Having made such a strong breakout, USD/JPY has risen to a critical juncture. With further upside momentum on renewed expectations of a Fed rate hike in December, the next major upside target is around the 125.00 resistance level. Tentative downside support after the breakout now resides at the noted 122.00 previous resistance level.
Source: FOREX.com
AUD/USD
AUD/USD continued to fluctuate under key 0.7200 resistance this past week as it continued to be weighed down by increased speculation over an impending Fed rate hike in the US as well as the specter of future interest rate cuts by the Reserve Bank of Australia. AUD/USD continues to be deeply entrenched within a sharp downtrend that has been in place for well more than a year, and the directional bias currently remains firmly to the downside. After the US Non-Farm Payrolls report release on Friday, AUD/USD hit a new one-month low on a strong US dollar. If the currency pair continues to trade under 0.7200, the next major downside targets immediately to the downside are at the 0.7000 psychological level followed by the 0.6800 support objective.
Source: FOREX.com
NFP paves the way for a Fed rate hike in December
Let’s skip the formalities: today’s NFP report was essentially perfect. The marquee US (and global) jobs report showed that the world’s largest economy created a stunning 271k jobs, crushing economist’s best estimate of 181k and the previous report’s negatively-revised 137k reading.
While our forecast was above consensus, even we didn’t anticipate such a stellar report. Beyond the headline number of jobs created, the under-the-surface details were just as strong. As expected, the unemployment rate fell by 0.1% down to just 5.0%, a 7.5-year low. Meanwhile, average hourly earnings rose by 0.4% m/m, crushing the estimated 0.2% gain and suggesting that last month’s flat reading was an aberration. With this sign that wages are starting to pick up meaningfully, the Fed will have a difficult time rationalizing leaving interest rates unchanged in December.
In fact, when it comes to the Federal Reserve’s rate hike plans, the most important tidbit from today’s NFP report wasn’t even in the report. Throughout this year, stocks have tended to fall when NFP beat expectations as traders feared that the Federal Reserve would raise interest rates. In the wake of today’s essentially perfect report though, US equities have actually rallied to a nearly 3-month high. This bullish reaction shows that the market is implicitly giving the Fed permission to raise interest rates, unlike the “Taper Tantrum” of 2013 and the big swoon a few months ago. In other words, the dog (Fed) has started to wag the tail (markets) once again.
Not surprisingly, the implied odds of a Fed rate hike next month have skyrocketed, according to the CME’s FedWatch tool. From around 60% before the report (and as low as 30% a few weeks ago), futures traders are now pricing in a 70% chance the Fed will increase interest rates next month, and we agree with this assessment. At this point, it seems like only a string of disappointing economic reports to dissuade the Fed from acting next month, something we don’t anticipate at this time.
Market Reaction
The market’s reaction to the jobs report has been sudden and dramatic. The US dollar has surged across the board, with the dollar index gaining over 1% to trade back at 99.00, above key previous resistance in the 98.00-50 area. At the same time, EUR/USD has dropped through key previous support at the 1.0800 area, USD/JPY is solidifying its breakout above the 121.50 resistance level, and gold has dropped to within 10 points of its 5.5-year low at 1080. As noted above, US equities are ticking higher, and the yield on the U.S. 10-Year benchmark government bond is rising 8bps to 2.31%.
In our view, these trends could last throughout the rest of the day and stretch into next week as more and more traders become convinced that the Fed is likely to act in December.
Look Ahead: Stocks
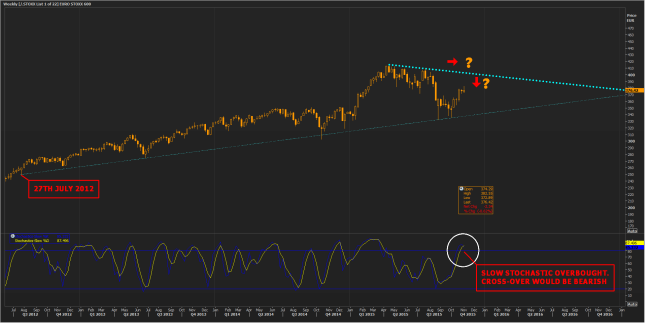
Europe’s broad blue-chip index, the Stoxx Europe 600 has been trending higher for at least 40 months, according to charts, but events in recent months have caused investors to question how much longer the long-term rally can last.
On a shorter-term time frame, European markets have been severely challenged this year amid concerns about slowing emerging-market economies, particularly China’s, with Stoxx losing more than 20% between April and September.
The likelihood of tightening monetary conditions across the Atlantic—prospects of which will be clearer after Friday’s US employment data—has triggered a wider review of the financial and economic strength of Europe and its corporates.
Specific European headwinds include a deceleration of earnings on aggregate in the most recent quarter, with earnings expected to decline 4.3% from Q3 2014.
169 Stoxx 600 companies have reported Q3 earnings to date, with 44% of these beating forecasts, compared to a typical quarter during which 49% beat EPS estimates, according to Thomson Reuters.
Despite these challenges, it’s arguable that both the natural pace of global economic recovery and the European Central Bank’s initial €60bn quantitative easing between 2009-2012 helped kick-start corporate recovery.
The ECB opened its cash spigot wider in March this year, with bond purchases of €60bn per month, targeting $1.1 trillion by September, or “until we see a continued adjustment in the path of inflation” to quote ECB President Mario Draghi, in January.
At the central bank’s most recent meeting, Draghi affirmed that commitment and the ECB is expected to add additional monetary stimulus in the medium term, responding to persistently weak GDP, retail sales, inflation and Purchasing Managers Indices.
In theory therefore, Eurozone equities can be expected to relatively outperform those in the US as the euro continues to fall against the dollar to reflect the implicit and actual rates differentials.
To be sure academics and policymakers have certainly argued over the efficacy of QE—particularly its ‘transmission mechanism’.
However, it’s difficult to argue with tremendous ascent of stock markets in countries where outright QE has been established for longer than Europe.
Since November 2010 S&P 500 70%-plus gains over five years and Nikkei 225 225’s 100%.
For the weeks ahead, investors should monitor both the continued quarterly performance of European companies—48 Stoxx firms will report Q3 results during the week beginning 9th November, and of course, the latest developments with regards to US interest rates.
On a technical basis, Stoxx Europe’s weekly chart suggests its biggest potential challenge in the near term a descending trend that formed in April at 415.
The Slow Stochastic momentum indicator is trading in the ‘overbought’ zone, increasing potential risks of falls.
The classic confirmation signal from this indicator is when its lines cross beyond either of its boundaries.
WEEKLY CHART OF STOXX EUROPE 600 INDEX

Source: FOREX.com. Please note this product is not available to US traders.
Look Ahead: Commodities
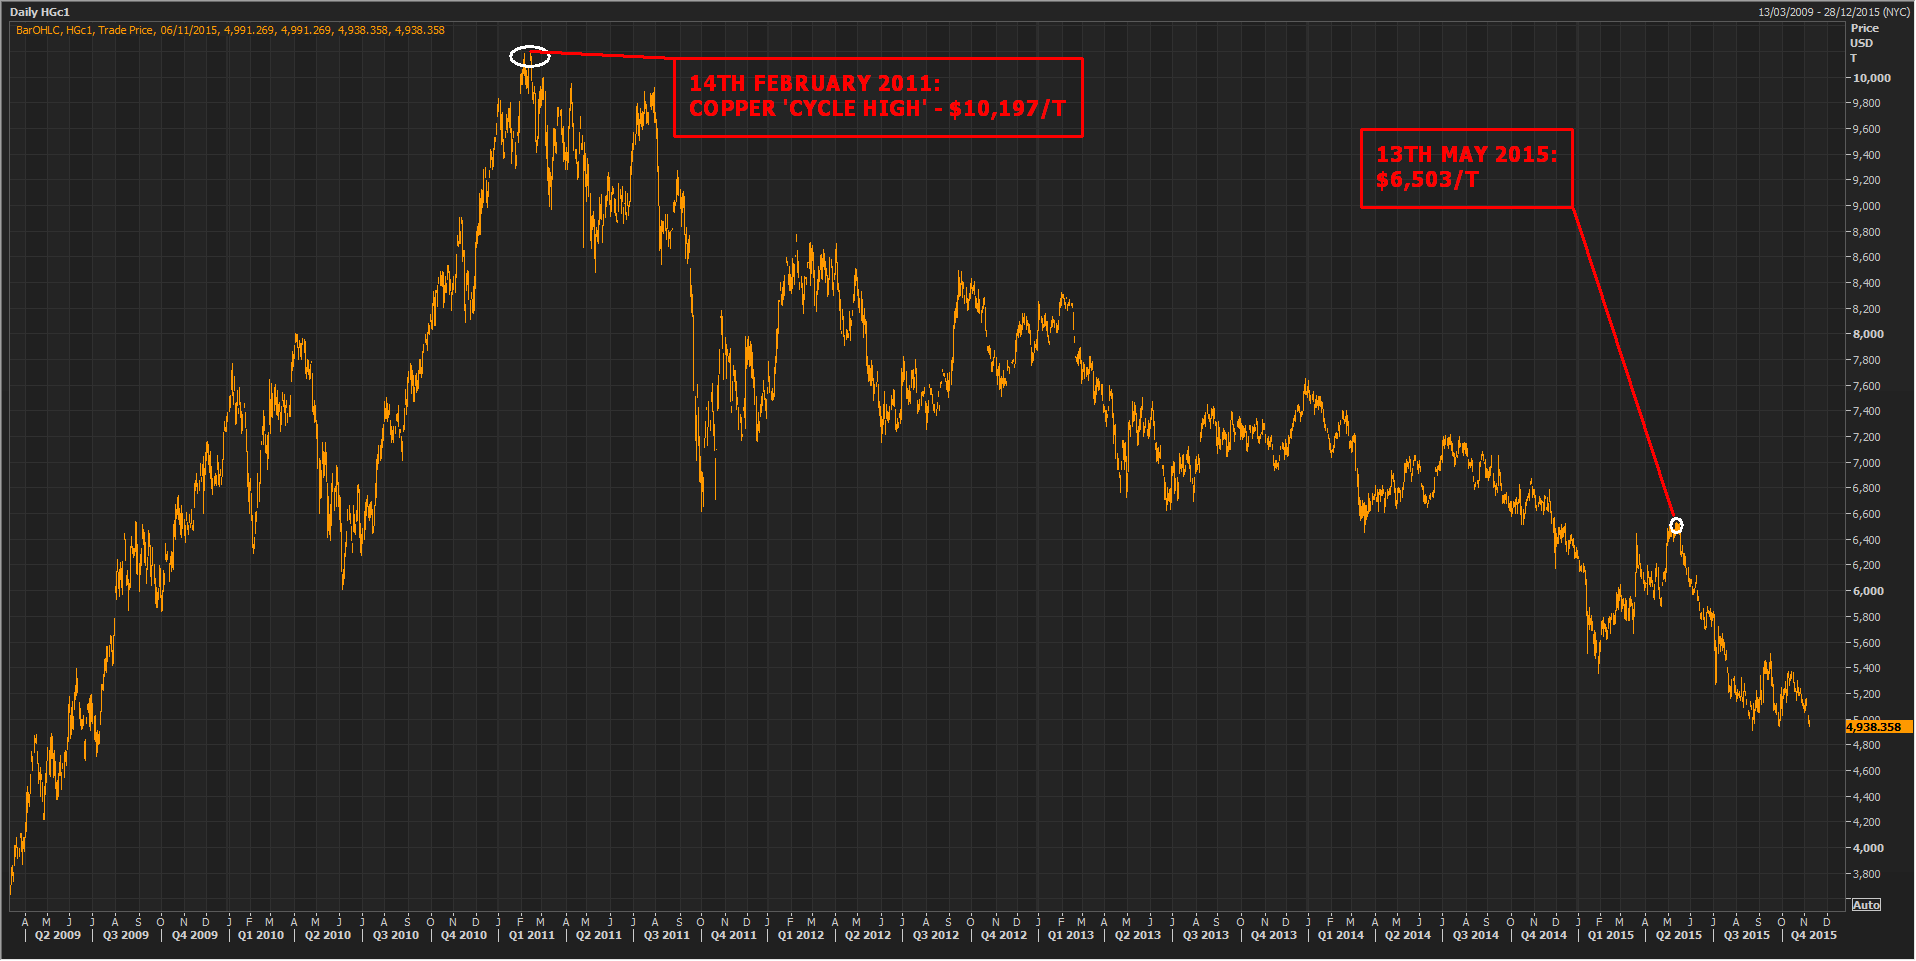
Copper's calamitous collapse has been amongst the most spectacular price falls by industrial metals over the last two years.
Actually, benchmark prices are about 50% lower than their peak of about $1,0190 per ton in February 2011.
The chart below shows prices for COMEX exchange’s copper futures contracts since Q2 2010. It should contextualize what appeared to be a recent stabilization of the metal’s price decline. Prices rose almost 20% between January and May this year, reaching $6,503/T. However, those gains have since been relinquished and prices are again close to their lowest since 2011.
In recent weeks, hopes for price rebounds have been stoked by high-profile output cuts by copper producers, but it has also been reported that some mine owners are resisting cuts in production by hedging when prices pop higher. Others are absorbing losses because shutdown costs are even steeper, while fear of painful job losses is keeping still other loss-making operations alive.
In China, government pressure has been observed, with the likely aim being to prop up enterprises in order to maintain employment.
Commodity trader and miner Glencore (L:GLEN) has been the most prominent among the major mining groups to cut output, which spurred a moderate rally in copper this week. However, elsewhere, copper production has been increased. Late in October, OZ Minerals Ltd (AX:OZL), Australia's third largest copper miner, said it would dig up to 20% more of the metal this year than previously touted. It cited a weak local currency that would give domestic producers an advantage over international rivals.
A depreciating Aussie dollar has cushioned the impact on Australian miners of the sharp drop in US dollar-denominated international copper prices, giving them a boost at a time when overseas peers are curbing production and freezing expansion work. At the very least, marginal upticks aside, it’s far too early to get optimistic about copper prices.
DAILY CHART OF COMEX COPPER FUTURE
Source: FOREX.com. Please note this product is not available to US clients
Global Data Highlights
Monday, November 9
No major economic data scheduled.
Tuesday, November 10
00:30 GMT – NAB Business Confidence
This widely-followed survey of Australian business confidence has been relatively subdued in the single digits this entire year. When business is humming along, as it last was coming out of the Great Financial Crisis in 2010 and 2011, readings above 10 were the norm, but for this month, traders would likely be satisfied with any reading around last month’s 5. If we see a number closer to 1 or 2 released, it would signal that businesses have substantial reservations about the future and that the RBA may be forced to cut interest rates in the future.
1:30 GMT – Chinese CPI
Like it is in the rest of the world, inflation remains subdued in China. While the PPI (Producer Price Index) measure has been persistently negative of late, the CPI (Consumer Price Index) readings have been steady in the 1-2% range. Another reading in this area is expected, and based on the upturn in other Chinese economic reports, a hotter-than-expected reading is definitely possible.
Wednesday, November 11
9:00 GMT – BOE Inflation Report Hearings
BOE Governor Mark Carney’s quarterly grilling from Parliament is scheduled for early this week, and he’s likely to provide more color on the central bank’s downbeat Quarterly Inflation Report (QIR) from last week. Carney’s been known for changing his views rapidly, but we merely expect him to reiterate his previous dovish comments, with potentially negative implications for the British pound.
20:00 GMT – RBNZ Financial Stability Report
Unlike the Fed and Bank of England, which release updates to their long-term economic views quarterly, the RBNZ’s version is only released twice per year. As such, it tends to be a big market-mover for the kiwi and other NZ assets. After last week’s disappointing GDT auction and weak employment report, we would anticipate a downbeat assessment of the economy; traders will also want to tune in for RBNZ Governor Wheeler’s accompanying press conference.
Thursday, November 12
0:30 GMT – AU Employment Report
Prior to last month’s disappointing 5.1k decline in jobs, the Australian labor market had “beat” estimates for the four previous months. Of course, monthly employment reports are notoriously volatile, so we hesitate to read too much into last month’s miss, but another weak report could leave traders wondering whether a new, bearish trend had developed. With a couple of other high-impact economic reports out of Australia and China this week, traders should be sure to revisit the data at the end of the week to discern whether a consistent trend is emerging.
Friday, November 13
10:00 GMT – Eurozone Q3 GDP
After heavy hints that the European Central Bank (ECB) was considering expanding stimulus last month, the Eurozone’s Q3 economic growth will be closely watched. For what it’s worth, the Eurozone economy hasn’t seen a quarterly contraction since Q1 2013, so as long as we see a reading above that threshold, traders will likely avoid panic. EUR/USD traders may want to keep an eye on the critical 1.0800 pivot level in the wake of this release.
13:30 GMT – US Retail Sales
In a generally quiet week for US economic data, Friday’s Retail Sales report will be an important release. The US consumer has been chugging along at a consistent, if unimpressive pace after the weather-driven Q1 swoon, but last month’s report only showed a 0.1% m/m increase in retail sales. The Fed - and dollar bulls - will be disappointed if we see another similarly subdued reading in this week’s report.

