Two weeks ago (I finally got a weekend away last week) my WTWA theme was a return to normalcy: Less Washington and more market fundamentals. This was pretty accurate in the focus on earnings. Less accurate was my prediction that good economic news would be good news. The market still has a Fed fixation.
Like others, I have looked each week for signs of a significant market correction. One by one we have navigated the various threats through the May to October period of seasonal weakness. Is it now time for the regular seasonal strength?
Is it time for a year-end rally?
There is the typical range of perspectives, but let us consider two dramatically contrasting viewpoints:
- Market bubble and/or crash. The roster is growing! It is far beyond the warnings of the leading investment site, the one built on fear. It is beyond the Faber and Schiff themes. Beyond Hussman and Mauldin. We now have reached the mainstream of Business Insider and USA Today.
- Henry Blodget summarizes his conclusion about why the market will crash in the next year or two and provide poor returns over the next decade.
- USA Today asks "Is Fed inflating stock bubble?"
- Bullish. From Oppenheimer's fine Chief Investment Strategist, John Stoltzfus. (I cannot provide a link. You need an OpCo relationship to get this valuable research).
As the kids and those "young at heart" gear up for Halloween, it appears to us that over the last week or so the same faces that successfully discouraged legions of investors from participating in the rallies that have followed the low of March 2009 have returned in force and onto the media landscape with the same argument that the markets advanced is solely attributed to QE and other extraordinary efforts by the Fed.
We disagree. Since March of 2009, when equities began their rally from the lows of the Great Financial Crisis, the market, as illustrated by the S&P 500 performance, has reflected domestic and global challenges that ranged from banking sector troubles on both sides of the Atlantic, to fiscal and sovereign debt issues and persistent skepticism of the economic and market recovery.
Anecdotally we recall that fourth-quarter angst has been nearly as common as a spring (April/May) market peak over the last two years or so.
We urge investors to stay focused on the many improvements in the economy that have been realized over the last few years, including: falling initial jobless claims, improved economic growth, increased hiring, rising earnings, improved consumer confidence, moderate growth and low inflation, higher home prices, strong car sales. All of the aforementioned have contributed to positive developments in services and manufacturing and have been reflected in the markets. Expect progress, not perfection. Stay tuned. [Emphasis in the original]
I have some thoughts about the rest of the year, which I'll report on those in the conclusion. First, let us do our regular update of last week's news and data.
Background on "Weighing the Week Ahead"
There are many good lists of upcoming events. One source I regularly follow is the weekly calendar from Investing.com. For best results, you need to select the date range from the calendar displayed on the site. You will be rewarded with a comprehensive list of data and events from all over the world. It takes a little practice, but it is worth it.
In contrast, I highlight a smaller group of events, including some you have not seen elsewhere. My theme is an expert guess about what we will be watching on TV and reading in the mainstream media. It is a focus on what I think is important for my trading and client portfolios. Each week I consider the upcoming calendar and the current market, predicting the main theme we should expect. This step is an important part of my trading preparation and planning. It takes more hours than you can imagine.
My record is pretty good. If you review the list of titles it looks like a history of market concerns. Wrong! The thing to note is that I highlighted each topic the week before it grabbed attention. I find it useful to reflect on the key theme for the week ahead, and I hope you will as well.
This is unlike my other articles where I develop a focused, logical argument with supporting data on a single theme. Here I am simply sharing my conclusions. Sometimes these are topics that I have already written about, and others are on my agenda. I am putting the news in context.
Readers often disagree with my conclusions. Do not be bashful. Join in and comment about what we should expect in the days ahead. This weekly piece emphasizes my opinions about what is really important and how to put the news in context. I have had great success with my approach, but feel free to disagree. That is what makes a market!
Last Week's Data
Each week I break down events into good and bad. Often there is "ugly" and on rare occasion something really good. My working definition of "good" has two components:
- The news is market-friendly. Our personal policy preferences are not relevant for this test. And especially -- no politics.
- It is better than expectations.
The Good
With the shutdown-delayed news coming out, there are plenty of items to consider. Some of the data is a little old. Since this update covers two weeks, I am reaching beyond last week for a few key items.
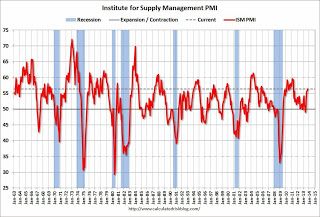
- ISM manufacturing was very strong, the best report in over two years. Calculated Risk includes analysis and the chart below. Steven Hansen of GEI is less impressed, saying that the "index has been in a general downtrend since mid-2011." He includes detailed discussion of the survey items.
- China's PMI is stronger, basically supporting a growth rate of 7.5%. (Via Barron's). The independently determined HSBC survey is a touch lower, but shows the same pattern. Here is analysis from the WSJ. Regular readers know that I share the popular skepticism of "official" data. I also discount non-quantified assertions about ghost cities. I try to stick with the best data we have, and it does not support the multi-year forecast of a "hard landing."
- Investors are 48% in cash according to BlackRock's survey. Meanwhile, BlackRock's Larry Fink joins the "bubble camp." What conclusion would you draw from this?
- Earnings "beat rate" is strong at 74% via FactSet with most also beating on sales. (But see "the bad" below).Brian Gilmartin also notes that the overall earnings growth rate has been heavily influenced (from 5.9% to 3.3%) by JP Morgan's charge,
- Case-Shiller home prices increased 12.8%, beating expectations. (Via Calculated Risk).
- Business lending is higher. Scott Grannis illustrates this relationship, which is important to job creation from small business.
- Financial conditions are at a new high according to the Bloomberg Index. Scott Grannis notes that this has been an excellent recession predictor in the past.
The Bad
The news updates included plenty of bad news.
- Michigan sentiment was terrible. Steven Hansen notes it as the lowest level since December, 2012, and provides plenty of detail.
- Net Employment growth has declined, apparently at a lower plateau. The September employment report was a disappointment. Last week's ADP private employment gain was only 130K. This is approximately the level needed to maintain the current unemployment rate. I am scoring this as "bad" because that is where the data take us. There is a bright spot from the improvement in the full-time/part-time question. I took up the topic here. My friend Doug Short responded to my "innocent" tweak with a first-rate update of his analysis of the factors behind the shift to part-time jobs. Those who insist on confusing their political viewpoint with their investment decisions should definitely read this discussion.
- Earnings guidance has been weak (via FactSet). Lowered guidance from 66 companies versus increases from 13. (But see "the good" above).
- Little headway from the Congressional Budget Conference Committee. Stan Collender expects continuing sequestration, but he warns not to take the early discussions too seriously. I agree.
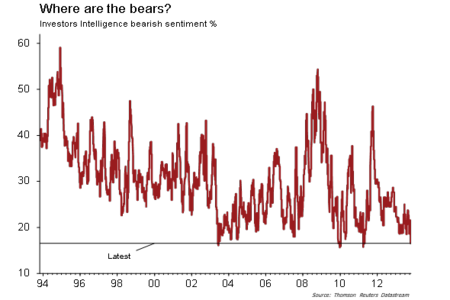
- Bearish sentiment is waning. This is popularly viewed as a contrarian indicator. FT Alphaville has the full story from various sources as well as a comment on accuracy. Here is a featured chart:
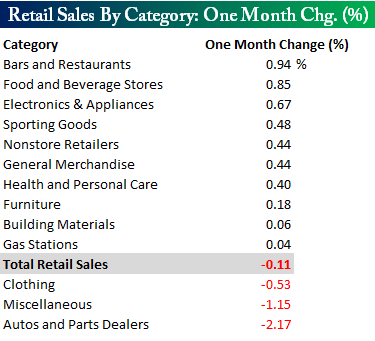
- Retail Sales disappointed. Bespoke has complete analysis, noting that auto sales were probably affected by the early Labor Day holiday. There are the great charts we expect at Bespoke, as well as this table showing the breakdown by category:
The Silver Bullet
I occasionally give the Silver Bullet award to someone who takes up an unpopular or thankless cause, doing the real work to demonstrate the facts. Think of The Lone Ranger.
This week's award goes to Stephen Suttmeier and Barry Ritholtz, who take on the oft-cited current levels of margin debt. There are many versions of this chart, but the basic thesis is that peaking levels of margin debt are a sign of a market top. I have looked carefully at the charts and the variation seems largely coincident, with margin levels sometimes leading and sometimes following. This has been on my (ever-growing) agenda, but it requires some careful research.
Merrill's Suttmeier includes the margin debt rate of change as an indicator of whether a rising market is peaking or breaking out. Barry notes, "If the rate of change data somehow corresponds to past shifts in secular markets from bears to bulls, this is potentially a very significant factor."
This analysis is much more sophisticated than what you usually see on this topic. I would love to see more research here, but this provides some needed balance. Here is a summary chart of the basic relationship, but I recommend reading the entire post. 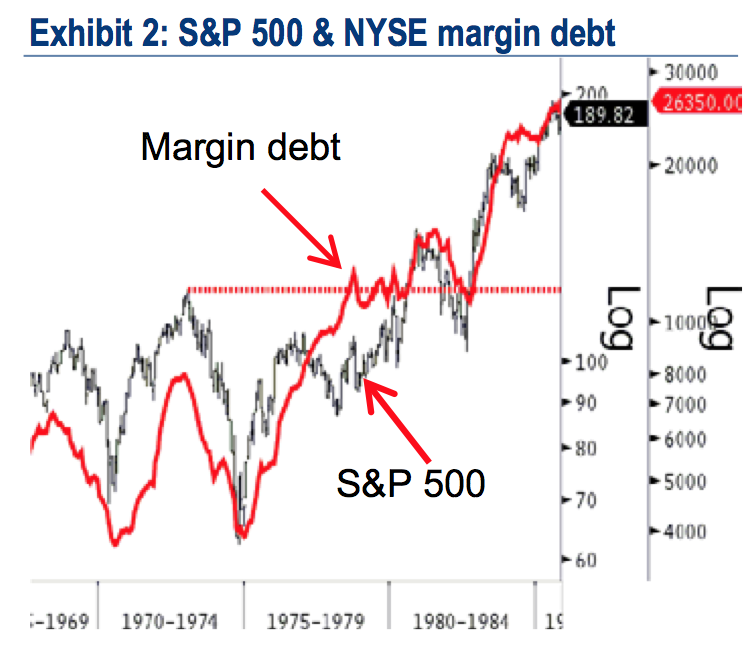
The Indicator Snapshot
It is important to keep the current news in perspective. I am always searching for the best indicators for our weekly snapshot. I make changes when the evidence warrants. At the moment, my weekly snapshot includes these important summary indicators:
- For financial risk, the St. Louis Financial Stress Index.
- An updated analysis of recession probability from key sources.
- For market trends, the key measures from our "Felix" ETF model.
Financial Risk
The SLFSI reports with a one-week lag. This means that the reported values do not include last week's market action. The SLFSI has recently edged a bit higher, reflecting increased market volatility. It remains at historically low levels, well out of the trigger range of my pre-determined risk alarm. This is an excellent tool for managing risk objectively, and it has suggested the need for more caution. Before implementing this indicator our team did extensive research, discovering a "warning range" that deserves respect. We identified a reading of 1.1 or higher as a place to consider reducing positions.
The SLFSI is not a market-timing tool, since it does not attempt to predict how people will interpret events. It uses data, mostly from credit markets, to reach an objective risk assessment. The biggest profits come from going all-in when risk is high on this indicator, but so do the biggest losses.
Recession Odds
I feature the C-Score, a weekly interpretation of the best recession indicator I found, Bob Dieli's "aggregate spread." I have now added a series of videos, where Dr. Dieli explains the rationale for his indicator and how it applied in each recession since the 50's. I have organized this so that you can pick a particular recession and see the discussion for that case. Those who are skeptics about the method should start by reviewing the video for that recession. Anyone who spends some time with this will learn a great deal about the history of recessions from a veteran observer.
I also feature RecessionAlert, which combines a variety of different methods, including the ECRI, in developing a Super Index. They offer a free sample report. Anyone following them over the last year would have had useful and profitable guidance on the economy. RecessionAlert has developed a comprehensive package of economic forecasting and market indicators. They have an update on their SuperCycle approach, a method that combines seasonality and recession risk. This chart is an example: 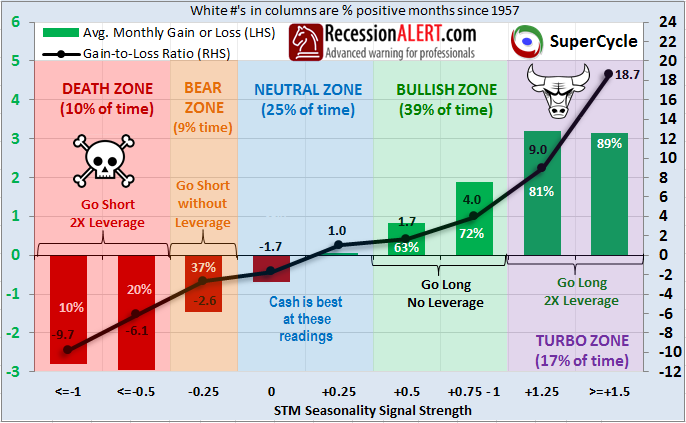
Georg Vrba's four-input recession indicator is also benign. "Based on the historic patterns of the unemployment rate indicators prior to recessions one can reasonably conclude that the U.S. economy is not likely to go into recession anytime soon." Georg has other excellent indicators for stocks, bonds, and precious metals at iMarketSignals.
Unfortunately, and despite the inaccuracy of their forecast, the mainstream media features the ECRI. Doug Short has excellent continuing coverage of the ECRI recession prediction, now two years old. Doug updates all of the official indicators used by the NBER and also has a helpful list of articles about recession forecasting. Doug also continues to refresh the best chart update of the major indicators used by the NBER in recession dating. The ECRI approach has been so misleading and so costly for investors, that I will soon drop it from the update. The other methods we follow have proved to be far superior.
Readers should review my Recession Resource Page, which explains many of the concepts people get wrong. There is now an updated analysis showing the impact of the government shutdown – moving some measures into "recession warning" territory.
Here is our overall summary of the important indicators. 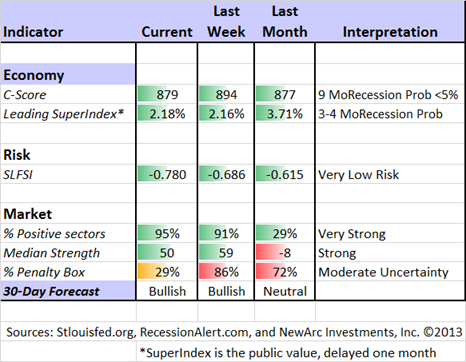
Our "Felix" model is the basis for our "official" vote in the weekly Ticker Sense Blogger Sentiment Poll. We have a long public record for these positions. Over the six weeks Felix has ranged over the full spectrum – twice! The market has been moving back and forth around important technical levels, driven mostly by news.
Felix does not react to news events, and certainly does not anticipate effects from the headlines. This is usually a sound idea, helping the trading program to stay on the right side of major market moves. Abrupt changes in market direction will send sectors to the penalty box. The Ticker Sense poll asks for a one-month forecast. Felix has a three-week horizon, which is pretty close. We run the model daily, and adjust our outlook as needed.
The penalty box percentage has decreased dramatically, meaning that we have more confidence in the overall ratings.
[For more on the penalty box see this article. For more on the system ratings, you can write to etf at newarc dot com for our free report package or to be added to the (free) weekly ETF email list. You can also write personally to me with questions or comments, and I'll do my best to answer.]
The Week Ahead
There is still a lot of data as the delayed reports combine with timely releases.
The "A List" includes the following:
- Employment report (F). The October report was delayed by a week since the government shutdown interfered with data collection. The survey period is the week of October 6th– 12th, so the data are less current than usual. The Fed's emphasis on employment gives this even more significance than usual.
- Michigan Sentiment (F). Watched closely because of the consumer reaction to the 2011 shutdown.
- The ISM services index (T). Will service match the strength in the manufacturing data?
- Leading indicators (W). Controversial, but still a favorite for many.
The "B List" includes:
- Initial jobless claims (Th). Less interesting than usual because of the California and shutdown effects.
- Personal income and spending (F). Important read on the economy but September data.
- GDP (Th). First report for Q3 already seems dated and will get revised.
- Factory orders (M). August data
There will also be plenty of FedSpeak in the wake of the FOMC decision as well as more earnings reports.
How to Use the Weekly Data Updates
In the WTWA series I try to share what I am thinking as I prepare for the coming week. I write each post as if I were speaking directly to one of my clients. Each client is different, so I have five different programs ranging from very conservative bond ladders to very aggressive trading programs. It is not a "one size fits all" approach.
To get the maximum benefit from my updates you need to have a self-assessment of your objectives. Are you most interested in preserving wealth? Or like most of us, do you still need to create wealth? How much risk is right for your temperament and circumstances?
My weekly insights often suggest a different course of action depending upon your objectives and time frames. They also accurately describe what I am doing in the programs I manage.
Insight for Traders
Felix continues in bullish mode. In our trading accounts we have been fully invested and the positions have gradually become more aggressive. Felix's ratings have been in a fairly narrow range for several months. The rapid news-driven shifts are not the ideal conditions for Felix's three-week horizon. This week we see both higher ratings and fewer sectors in the penalty box. It is the best combination in months.
Insight for Investors
I review the themes here each week and refresh when needed. For investors, as we would expect, the key ideas may stay on the list longer than the updates for traders.
- Headlines. The challenge for investors is to distinguish between the major trends and the short-term uncertainty. The main themes are not related to headlines news, even though sentiment may drive market fluctuations. Do not be seduced by the idea that you can time the market, calling every 10% correction. Many claim this ability, but few have a documented record to prove it. Most who claim past success are using a back-tested model. Please see The Seduction of Market Timing.
- Risk Management. It is far better to manage your risk, specifically considering the role of bonds and the risk of bond mutual funds. As I emphasized, "You need to choose the right level of risk!" Right now, it is the most important question for investors. There is plenty of "headline risk" that may not really translate into lower stock prices. Instead of reacting to news, the long-term investor should emphasize broad themes.
- Avoiding the "fear trade." I covered this pretty carefully a couple of weeks ago. Those who participated in our "methadone program" for gold addiction enjoyed some nice gains in our substitute, Freeport-McMoRan Copper and Gold (FCX). This made 35% in a few months, counting both dividends and stock appreciation, but we have now moved on because of valuation. Gold lost 3% last week, but the rationale is even more disturbing. Gold traders are intensely focused on the Fed. Since I do not expect any big changes in Fed policy, nor any major effects from the first moves, this is simply a wrong-headed trade. Individual investors have been chased into gold because of fear of economic collapse (via deflation), or hyperinflation, or sometimes both at the same time. Since none of these outcomes is very likely, you should have only a small allocation to precious metals.
And finally, we have collected some of our recent recommendations in a new investor resource page -- a starting point for the long-term investor. (Comments and suggestions welcome. I am trying to be helpful and I love feedback).
Final Thought
If I were to summarize the current market in a single sentence, it would be the following:
When a market theme hits USA Today, it is too late for action.
The "bubble theory" is so prevalent, that investors hold 48% in cash – owning neither stocks nor bonds.
There is so much bad advice for the individual investor that I despair. Here are a few conclusions. While these are carefully considered, I cannot analyze each in the weekly review. Feel free to take up the issues in the comments!
- Those who have been completely wrong abandon past indicators and pick new ones. There are good reasons for late-year seasonal strength.
- Think beyond the next two months. Do not be a slave to the calendar. Many are focused on their annual predictions and bonuses. Bullish predictors have already won, so they skew to a conservative posture. Bearish hedge fund guys need a market decline to meet performance targets.
- This is not an average cycle – not for businesses and not for stocks. Usually there is a decline and a rebound. This time there was a sharp decline and a gradual rebound. The result? The Fed will be aggressive for much longer. It will probably be 2016 before policy is back to neutral. It is silly to create a template based upon a handful of cycles and expect a new case to fit the model.
- The YTD gains are exaggerated. We started the year with fear from the fiscal cliff debate. When that was avoided, we had an instant gain of 7%. We should have asked everyone to re-calibrate predictions from that date.
- There is an epidemic of top-calling. Everyone who has been completely wrong about the market is finding excuses. Since much of the audience for the financial media – both print and TV – consists of those thinking short-term, the fear factor is high.
- The return of the individual investor is just getting started. Each week I read about mutual fund and ETF flows. The shifts from individual investors are highlighted as late money – dumb. At some point this will be true, but I think it is far in the future. Let us revisit the topic when the average investor is "all in" instead of 48% in cash!
We can all argue about the true contrarian trade. At the moment, I agree with Felix. I see stocks as attractively priced, with plenty of value opportunities. While my predictions for the year have played out pretty well, I prefer to think about rolling twelve-month periods rather than rest on laurels for this year.

