The economic recovery, to the surprise of nearly everyone, has been consumer-driven. This has occurred despite increased savings and an overall improvement in household balance sheets. Businesses have been cautious to invest and to hire. State and local governments have been slashing spending and employees.
I expect a week with a consumer focus. It starts with data on retail sales, expected to be weaker from the payroll tax increase and lower gasoline spending. It ends with the important indicators on housing. There are several possible themes this week, but I expect the role of the consumer to be at the forefront of the discussion.
If you read but one piece in preparation I recommend the chart and data-filled speech from Fed Governor Elizabeth Duke, alertly reported at Global Economic Intersection. Here is a sample of the many good charts, but it is only one theme out of many.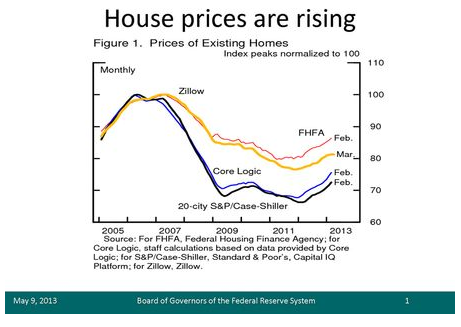
I have some thoughts on housing and the consumer which I'll report in the conclusion. First, let us do our regular update of last week's news and data.
Background on "Weighing the Week Ahead"
There are many good lists of upcoming events. One source I regularly follow is the weekly calendar from Investing.com. For best results you need to select the date range from the calendar displayed on the site. You will be rewarded with a comprehensive list of data and events from all over the world. It takes a little practice, but it is worth it.
In contrast, I highlight a smaller group of events. My theme is an expert guess about what we will be watching on TV and reading in the mainstream media. It is a focus on what I think is important for my trading and client portfolios.
This is unlike my other articles, where I develop a focused, logical argument with supporting data on a single theme. Here I am simply sharing my conclusions. Sometimes these are topics that I have already written about, and others are on my agenda. I am putting the news in context.
Readers often disagree with my conclusions. Do not be bashful. Join in and comment about what we should expect in the days ahead. This weekly piece emphasizes my opinions about what is really important and how to put the news in context. I have had great success with my approach, but feel free to disagree. That is what makes a market!
Last Week's Data
Each week I break down events into good and bad. Often there is "ugly" and on rare occasion something really good. My working definition of "good" has two components:
- The news is market-friendly. Our personal policy preferences are not relevant for this test. And especially -- no politics.
- It is better than expectations.
This was a good week for the markets, but it was a light week for data. The story was mixed.
- The projected US budget deficit for fiscal 2013 is now more than $231 billion lower than for 2012. (via the CBO). This is due to a combination of relatively modest spending increases and much higher revenues. It will provide some additional flexibility for policymakers to negotiate more comprehensive solutions.
- Banks are easing lending standards (via Calculated Risk). This is necessary for the widely-noted increase in the Fed's monetary base to turn into actual "money printing."
- Hotel bookings are strong (via Calculated Risk). That coincides with my personal experience!
The thin data week included a little bad news. Feel free to add in the comments anything you think I missed.
- The improved debt picture comes at a cost. Menzie Chinn discusses the impact of austerity in general and the sequester in specific. It is a lower path to reduced unemployment and slower economic growth. Most estimates of Q2 GDP growth have been lowered as a result.
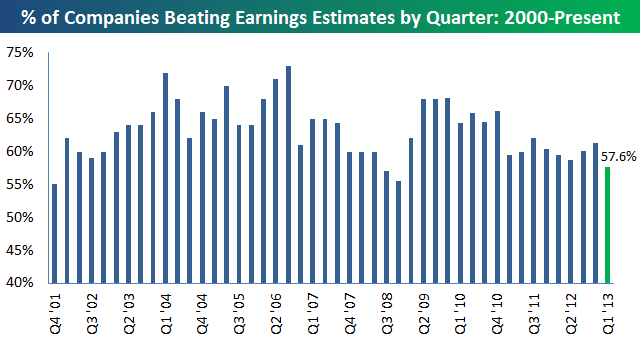
- The earnings beat rate dropped significantly this week, and the revenue beat rate is even worse. Here is one of the summary charts from Bespoke (check out the full article for the full story). And see Paul Vigna at the WSJ for a great discussion of specific factors.
- The Administration is looking for volunteer funding to implement ObamaCare. Good luck with that!
This week's ugly award is another Twitter effect. While not as big as last week's example, it shows how vulnerable we remain to rumors. This time the rumor hit on Thursday afternoon. The story was that John Hilsenrath, the well-connected Wall Street Journal reporter on the Fed beat, would release a story about the ending of QE. The story was expected to hit about an hour before the market close.
Stocks sold off on the rumor about a rumor. You could follow the discussion on Twitter -- a place where people explain market moves, but it also promotes moves for those who have advance information – even if they call it a rumor. You can check out the history and retweets here.
The substance of this rumor was pretty silly. The Fed members are all off giving speeches. They do not all agree. Hilsenrath's job is to write about this. Anyone paying attention knows that no policy change is imminent. You trade this stuff at your peril, as I wrote here. And here is the final WSJ article, coming out after the close on Friday.
The Silver Bullet
I occasionally give the Silver Bullet award to someone who takes up an unpopular or thankless cause, doing the real work to demonstrate the facts. Think of The Lone Ranger.
This week's award goes to Joe Taxpayer (with a HT to Josh Brown) for exposing another popular example of chart deception, over-fitting two data series by massaging the scales. Without the distortion there would be no nice-looking fit. Well done, Joe. 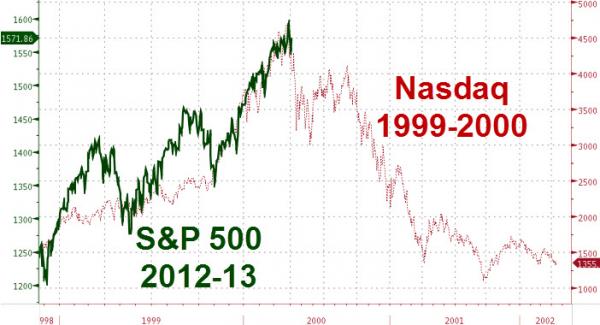
My problem is that I cannot award a Silver Bullet to someone refuting a straw man. It is much better if the winner identifies the source of the misleading information. I was not going to use this, but the misleading information was (not surprisingly) found at the most common source – ZH. While the chart is offered without comment, the "rating" is 4.5 from the enthusiastic crowd at that site.
[Question for readers: Should I only award the Silver Bullet when the author identifies the source of the error?]
Nominations are always open for more Silver Bullet candidates.
The Indicator Snapshot
It is important to keep the current news in perspective. My weekly snapshot includes the most important summary indicators:
- The St. Louis Financial Stress Index.
- The key measures from our "Felix" ETF model.
- An updated analysis of recession probability.
The SLFSI reports with a one-week lag. This means that the reported values do not include last week's market action. The SLFSI has moved a lot lower, and is now out of the trigger range of my pre-determined risk alarm. This is an excellent tool for managing risk objectively, and it has suggested the need for more caution. Before implementing this indicator our team did extensive research, discovering a "warning range" that deserves respect. We identified a reading of 1.1 or higher as a place to consider reducing positions.
The SLFSI is not a market-timing tool, since it does not attempt to predict how people will interpret events. It uses data, mostly from credit markets, to reach an objective risk assessment. The biggest profits come from going all-in when risk is high on this indicator, but so do the biggest losses.
The C-Score is a weekly interpretation of the best recession indicator I found, Bob Dieli's "aggregate spread." I have now added a series of videos, where Dr. Dieli explains the rationale for his indicator and how it applied in each recession since the 50's. I have organized this so that you can pick a particular recession and see the discussion for that case. Those who are skeptics about the method should start by reviewing the video for that recession. Anyone who spends some time with this will learn a great deal about the history of recessions from a veteran observer.
I have promised another installment on how I use Bob's information to improve investing. I hope to have that soon. Anyone watching the videos will quickly learn that the aggregate spread (and the C Score) provides an early warning. Bob also has a collection of coincident indicators and is always questioning his own methods.
I also feature RecessionAlert, which combines a variety of different methods, including the ECRI, in developing a Super Index. They offer a free sample report. Anyone following them over the last year would have had useful and profitable guidance on the economy. RecessionAlert has developed a comprehensive package of economic forecasting and market indicators, well worth your consideration. They did not supply updated data this week, but we hope to resume coverage soon.
Georg Vrba's model sees a decrease in unemployment to 6 percent in 2015, with a possible recession in early 2016. Georg has an array of interesting models on different themes – all with strong results, combining testing and real time.
Unfortunately, and despite the inaccuracy of their forecast, the mainstream media features the ECRI. Doug Short has excellent continuing coverage of the ECRI recession prediction, now well over a year old. Doug updates all of the official indicators used by the NBER and also has a helpful list of articles about recession forecasting. His latest comment points out that the public data series has not been helpful or consistent with the announced ECRI posture. Doug also continues to refresh the best chart update of the major indicators used by the NBER in recession dating. He writes this week:
Here are two significant developments since ECRI's initial recession call in September 2011:
- The S&P 500 is up 43.8%.
- The unemployment rate has dropped from 9.0% to 7.5%.
Doug also reviews the latest (umpteenth) change in the ECRI methods, showing why there is nothing magical about nominal year-over-year growth in GDP of 3.7%. Short answer: low inflation.
The average investor has lost track of this long ago, and that is unfortunate. The original ECRI claim and the supporting public data was expensive for many. The reason that I track this weekly is that it is important for corporate earnings and for stock prices. It has been worth the effort for me, and for anyone reading following us each week.
Readers might also want to review my Recession Resource Page, which explains many of the concepts people get wrong. 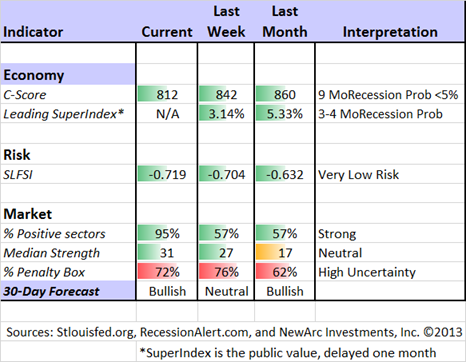
Our "Felix" model is the basis for our "official" vote in the weekly Ticker Sense Blogger Sentiment Poll. We have a long public record for these positions. Over the last few weeks we have varied between bullish and neutral. These are one-month forecasts for the poll, but Felix has a three-week horizon. Felix's ratings have improved significantly over the last two weeks. The penalty box percentage measures our confidence in the forecast. A high rating means that most ETFs are in the penalty box, so we have less confidence in the overall ratings. Since that measure remains elevated, we have less confidence in short-term trading.
[For more on the penalty box see this article. For more on the system ratings, you can write to etf at newarc dot com for our free report package or to be added to the (free) weekly ETF email list. You can also write personally to me with questions or comments, and I'll do my best to answer.]
The Week Ahead
This week brings plenty of data.
The "A List" includes the following:
- Initial jobless claims (Th). Employment will continue as the focal point in evaluating the economy, and this is the most responsive indicator.
- Building permits and housing starts (Th). Especially important right now.
- Michigan sentiment (F). Still not at recovery levels, and pressured by taxes and lagging employment.
- Leading economic indicators (F). This is still a favorite for some.
- Retail sales (M). Expect a slow start to the week due to reduced gasoline purchases and lower car sales.
- Industrial Production (W). Continues to be important in tracking economic growth.
- PPI (W). The headline numbers will be negative with a small positive for core (ex food and energy).
- CPI (Th). See PPI. No inflation pressure on the Fed.
Earnings season winds down. The regional Fed indexes matter only if there is an outsized move. The Fed members are on the speaking circuit, so expect plenty of (conflicting) signals from those sources. It is not like the Greenspan era, when members pretty much stayed "on message."
It is also options expiration week, adding to volatility.
Trading Time Frame
Felix has resumed a bullish posture, now fully reflected in trading accounts. It was been a close call for several weeks. Despite the move to a "neutral" overall rating, Felix continued to find at least three attractive sectors. The positions were pretty defensive until a few days ago. Felix has picked up the shift to cyclical stocks and technology.
To illustrate the change I have opened up my weekly column at Wall Street All Stars. This shows the entire rating list as of Wednesday, as well as my featured ETF for the week. (I am enjoying my participation with this group – especially the stock ideas. There are a many interesting suggestions from the community. One or more contributors will join in to answer questions).
As an additional update for WTWA readers, Felix added PowerShares QQQ ETF (QQQ) to the buy list on Friday. This is the only broad market ETF with a solid rating.
Investor Time Frame
Each week I think about the market from the perspective of different participants. The right move often depends upon your time frame and risk tolerance.
The danger to avoid
Investments traditionally regarded as safe are now among those with the greatest risk. Interest rates have been falling for so long that investors in fixed income are accustomed to collecting both yield and capital appreciation. An increase in interest rates will prove very costly for these investments. I highly recommend the excellent analysis by Kurt Shrout at LearnBonds. It is a careful, quantitative discussion of the factors behind the current low interest rates and what can happen when rates normalize.
Other yield-based investments have a similar or greater risk profile. As David Kehohane of FTAlphaville notes, even junk bonds are now yielding less than 5%!
A safer source of yield --what the market is giving you!
For the conservative investor, you can buy stocks with a reasonable yield, attractive valuation, and a strong balance sheet. You can then sell near-term calls against your position and target returns close to 10%, with risk far lower than a general stock portfolio.
Balance risk and reward
There is always risk. Investors often see a distorted balance of upside and downside, focusing too much on new events and not enough on earnings and value.
Three years ago, in the midst of a 10% correction and plenty of Dow 5000 predictions, I challenged readers to think about Dow 20K. I knew that it would take time, but investors waiting for a perfect world would miss the whole rally. In my next installment on this theme I will deal with the logic behind the prediction. It is important to realize that there is plenty of upside left in the rally, as Barron's notes this week in the cover story, We Were Right!
For the investor with a reasonable time horizon, there are many fine opportunities. While some stocks and sectors are overvalued, there are still many good choices. BreakingViews has the story:
Todd Builione, president of JPMorgan-owned hedge fund firm Highbridge Capital Management, said at the SkyBridge Alternatives conference on Wednesday that cyclicals now present a historic opportunity. They may be vulnerable to economic winds, but for now there's a big discount to compensate investors for that risk.
We have collected some of our recent recommendations in a new investor resource page -- a starting point for the long-term investor. (Comments and suggestions welcome. I am trying to be helpful and I love feedback).
Final Thought
Will the consumer step up on housing?
New Deal Democrat at The Bonddad Blog does a comprehensive update of leading indicators. There are many good charts, but here is one that I closely follow – building permits. There is a nice trend, but a recent stutter. 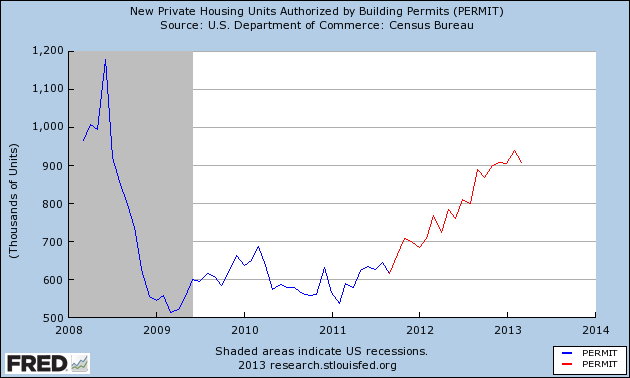
It is a crucial question. Calculated Risk is the best source on all things housing. Bill thinks that the bottom is in, and is following various indicators for the exact timing of the rebound. Check out his analysis from one month ago and join me in watching this month's data.
Moody's Analytics' Mark Zandi sees housing leading a rebound in employment. The WSJ quotes him as follows:
Mr. Zandi said building should return to normal precrisis levels of 1.8 million homes built per year from 900,000 in recent years. He added that every single-family home that is built generates 4.5 new jobs, every multi-family property creates two jobs, while the activity creates demand for a multitude of building materials and services.
Whether or not you agree with these three sources, you know what to watch. And keep in mind that you cannot possibly do worse than Wall Street "strategists" who have missed the last 16% move (via Josh Brown) with their lowest stock allocation in history. If you have trailed in your investment performance, you are not alone.
