The major stock indices – the Dow, SPX andNasdaq – have wafted up to all-time highs on a cloud of Central Bank printed money. Interestingly, most of the stocks in all three indices are below to well below their all-time highs. The breadth of the move is shockingly thin. Very few stocks are responsible for pushing the indices higher. The Dow’s move last Friday, for instance, was primarily attributable to AAPL (by far the biggest contributor), MSFT, HD, UTX and JPM. Of those, only AAPL, UTX and JPM hit their all-time high on Friday. MSFT and HD were close.
Many of the Dow stocks are down significantly this year. If you find this hard to believe, run the 1yr charts of the 30 Dow stocks. I’m certain the same is true for the SPX and Naz.
Despite the appearance of the stock market moving higher, most of the stocks that make up the 2800 stocks on the NYSE are well below their all-time and/or YTD highs. There’s plenty of money to be made shorting stocks despite the headline, mainstream media and White House’s euphoria over the stock market’s performance. Moreover, short interest in the SPY (NYSE:SPY) ETF has plunged to a level that has, in the past, led to sharp sell-offs in the stock market.
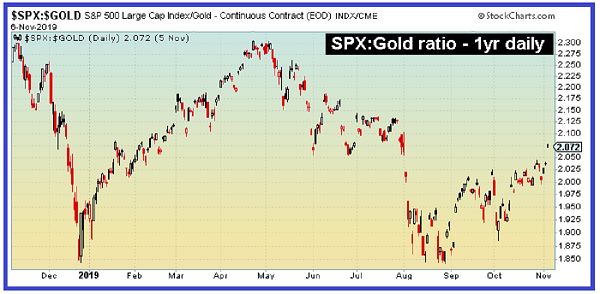
And then there’s this, which is the best measure of the real rate of return stocks:

Over the past 52 weeks through November 6th, the S&P 500 has declined 10.5% when measured in terms of gold – i.e. real money. Money printing at a rate in excess of real wealth output diminishes the marginal value of the currency. Because the price of gold moves inversely with the inherent value of the dollar, the chart above reflects the effect of dollar devaluation on financial assets.
Thus, the real upward movement of the stock market highly deceptive in terms of both the number of stocks in the NYSE participating in move higher and in terms of using real money to measure the price of stocks.
