Get 40% Off
👀 👁 🧿 All eyes on Biogen, up +4,56% after posting earnings. Our AI picked it in March 2024.
Which stocks will surge next?
Unlock AI-picked Stocks

The Most Useful Leading Indicator Of The Global Boom-Bust Cycle

Published 09/01/2017, 12:14 AM
Updated 07/09/2023, 06:31 AM

The long-term economic oscillations between boom and bust are caused by changes in the money-supply growth rate. It can therefore make sense to monitor such changes, but doing so requires knowing how to calculate the money supply. Unfortunately, most of the popular monetary aggregates are not useful in this regard because they either include quantities that aren’t money or omit quantities that are money.

What “Austrian” economists refer to as TMS (True Money Supply) is the most accurate monetary aggregate. Whereas popular measures such as M2, M3 and MZM contain credit instruments, TMS only contains money. Specifically, TMS comprises currency (notes and coins), checkable deposits and savings deposits.

The following chart shows the year-over-year TMS growth rate (the monetary inflation rate) in the US. It has fallen sharply over the past 8 months — from around 11% to around 5% — and is now at its lowest level since 2008.
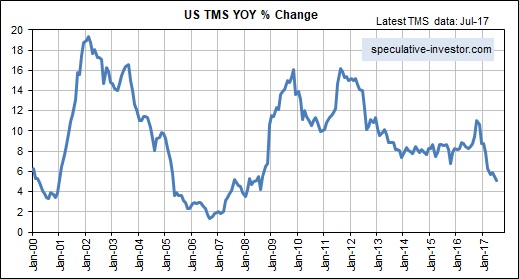
US TMS YOY % Change

The chart displayed above suggests that the US economic boom* is on its last legs. It may well be, but the 2002-2006/7 boom continued for almost 2 years after the US monetary inflation rate fell to near its current level in early-2005.

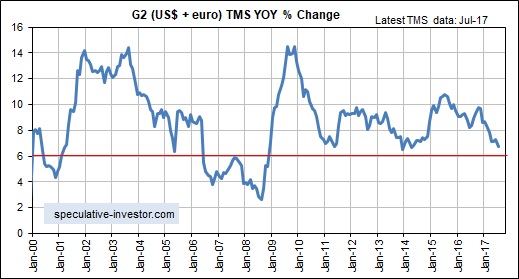
The reason for the long delay during 2005-2007 between the decline in the US TMS growth rate to a level that ordinarily would have ended the boom in less than 12 months and the actual ending of the boom was the offsetting effect of rapid monetary inflation in the euro-zone. This prompted me to develop a monetary aggregate that I call “G2 TMS”, which combines the US and euro-zone money supplies. Here is a monthly chart showing the growth rate of G2 TMS.
3rd party Ad. Not an offer or recommendation by Investing.com. See disclosure here or remove ads .

G2 US+Euro TMS YOY & Change

The rate of change in the G2 TMS growth rate has been the most useful leading indicator of the global boom-bust cycle over the past two decades. Of particular significance, a decline in the G2 TMS growth rate from well above 6% to below 6% warns of a shift from boom to bust within 12 months.

At the end of July the G2 TMS growth rate was slightly above the boom-bust transition level.

*An economic boom is defined as a multi-year period during which the creation of a lot of money out of nothing causes an unsustainable increase in economic activity.

Latest comments

Good analysis. Please post the charts again with US recessions highlighted, and SPX on another axis. That would make picture clearer
Risk Disclosure: Trading in financial instruments and/or cryptocurrencies involves high risks including the risk of losing some, or all, of your investment amount, and may not be suitable for all investors. Prices of cryptocurrencies are extremely volatile and may be affected by external factors such as financial, regulatory or political events. Trading on margin increases the financial risks.
Before deciding to trade in financial instrument or cryptocurrencies you should be fully informed of the risks and costs associated with trading the financial markets, carefully consider your investment objectives, level of experience, and risk appetite, and seek professional advice where needed.
Fusion Media would like to remind you that the data contained in this website is not necessarily real-time nor accurate. The data and prices on the website are not necessarily provided by any market or exchange, but may be provided by market makers, and so prices may not be accurate and may differ from the actual price at any given market, meaning prices are indicative and not appropriate for trading purposes. Fusion Media and any provider of the data contained in this website will not accept liability for any loss or damage as a result of your trading, or your reliance on the information contained within this website.
It is prohibited to use, store, reproduce, display, modify, transmit or distribute the data contained in this website without the explicit prior written permission of Fusion Media and/or the data provider. All intellectual property rights are reserved by the providers and/or the exchange providing the data contained in this website.
Fusion Media may be compensated by the advertisers that appear on the website, based on your interaction with the advertisements or advertisers.
© 2007-2024 - Fusion Media Limited. All Rights Reserved.