With the various US equity (cash) markets closed on Monday, Asian indices could still take their guide from the S&P 500 futures, as well as broad European equity trade.
Here, we can see S&P 500 futures trading overnight but closing at 05:00 aedt around 2728. So, with the index gradually falling from 2746 at 16:10 aedt (the official S&P 500/ASX 200 close), we obviously need to price in a 0.7% move lower in the S&P 500 futures.
European markets fared similarly, with the different indices lower by 0.5% to 1%. Our client flow centred on the FTSE 100 and German DAX, which closed 0.6% and 0.5% lower respectively, with the DAX just avoiding a close below Fridays low, which would have subsequently printed a bearish outside day reversal, and where the move lower was perhaps made more disappointing having failed to follow-through from the bullish sentiment expressed in Japan and Australia. Volumes were fairly poor, which again won’t surprise given China and US cash markets were off-line.
Italy has been sold down by most, with a 1% fall in the FTSE MIB, with price also just avoiding a close through Friday’s low. Ferrari (MI:RACE), Pirelli (MI:PIRC) and Fiat (MI:FCHA) have been a decent headwind for the index, which presumably is a play on the US looking to impose steel and aluminium tariffs which invariably would raise costs for anyone who uses these as an input.
There has been a focus on the Italian debt markets, where we can see Italy 10-year BTPs closing up 6 basis points (bp) at 2.04%. This is hardly great a concern at this stage but it becomes a focal point for macro watchers, as recent news headlines sparked worries over the sustainability of a possible centre-right coalition government, with party leaders Silvio Berlusconi and Matteo Salvini fighting over who will be prime minister should the coalition win on 4 March.
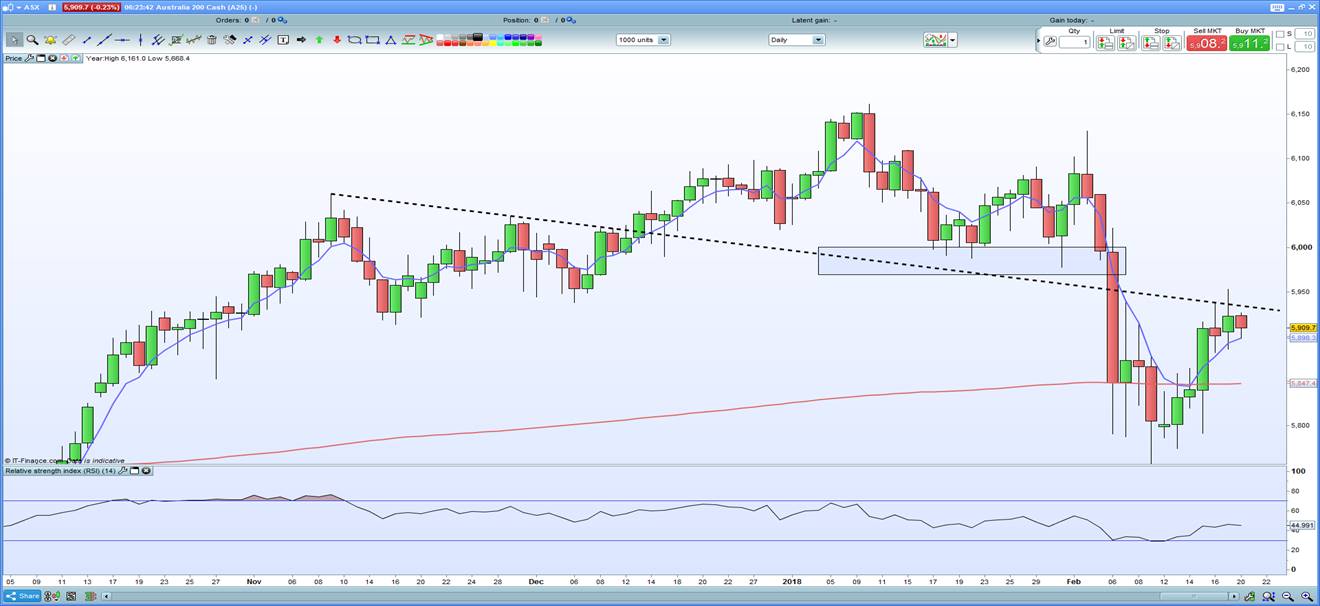
Aussie SPI futures currently reside at 5865, which is 37 points lower than 16:10 aedt and the official ASX 200 cash close, with price really being influenced by European markets and where we can see SPI futures trading a range of 5845 to 5876 over the past four hours. Invariably, the ASX 200 will face headwinds on open as a result and our call for the ASX 200 sits at 5909, -32 points or 0.5% lower. S&P 500 futures resume trade at 10:00 aedt and that should be a fairly uneventful event and traders will now start to sharpen their visual on the rest of the week’s event risk, which gets underway today with RBA minutes due at 11:30 aedt, with the German ZEW survey and eurozone consumer confidence coming later in the day, although these data points shouldn’t cause any great reaction ahead of the FOMC minutes and locally Aussie wage data (Wednesday 11:30 aedt), which both have the premise to move the dial if the market sees something it is not expecting.

The focus locally also falls on earnings where we get numbers from a raft of companies including BHP Billiton (AX:BHP), GPT Group (AX:GPT), Greencross (AX:GXL), Investa Office Fund (AX:IOF), Monadelphous Group (AX:MND), Northern Star Resources (AX:NST), Oil Search (AX:OSH), Sandfire Resources (AX:SFR), Seven West Media (AX:SWM), Vocus Group (AX:VOC), Virtus Health (AX:VRT) and Western Areas (AX:WSA).
BHP naturally takes centre stage reporting 1H18 numbers after the close, with consensus expectations sitting at underlying EBITDA of $11.5 billion, from revenue just north of $21 billion. BHP is expected to announce a dividend of around 50c per share (+25% yoy), although the shock would come should management decide to go down the same track as RIO, boosting future EPS expectations through a buy-back program. Although that could depend on gearing levels and where management sees net debt to EBITDA by the end of the year, not to mention if they have earmarked any capital for growth projects. The view on the street is BHP are more likely to recycle earnings back to shareholders through higher dividends, so the 66% dividend payout ratio seen last year may be lifted here and the risk a higher than 50c dividend seems elevated. Will that be enough to enthuse shareholders?
Locally economists and strategists will go through the RBA minutes, although given the market has heard so much from the RBA and its key members of late we shouldn’t get too many surprises and one suspects the market is now comfortably with the interest rate pricing of 5.5bp of hikes priced for August and 16.6 bp for December. The minutes shouldn’t give us too much new information and perhaps neither will tomorrows wages if they come in-line with consensus at 0.5% qoq and 2% yoy. AUD/USD has seen indecision on the daily, but again that won’t surprise, with US traders taking an extended weekend.
AUD/USD looks a bit directionless at present, but I am happy to be small longs on a break above $0.7950, while a move through Thursdays and Friday’s low of $0.7892 could open up a move into the figure and perhaps into the February swing low of $0.7759. EUR/AUD remains on the radar, and although I have been an advocator of buying a closing move through a$1.5771, equally, I would be small shorts on a close through a$1.5637 too.
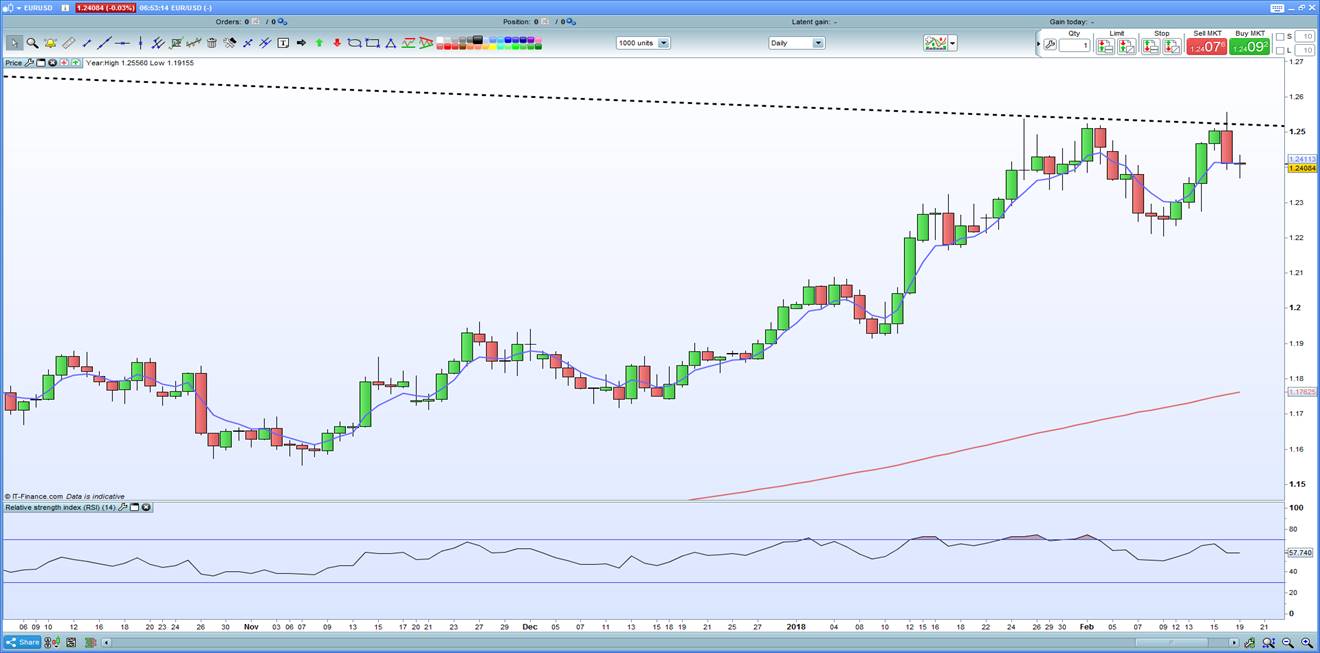
Another aspect worth highlighting is the focus on key personnel at the ECB and while the market has, perhaps prematurely, started to debate who will replace Mario Draghi as the head of the ECB next October. EUR/USD is more likely to be influenced by proceedings in the upcoming European data, US event risk and perhaps increasingly by sentiment on the Italian election. The pair is a buy on a close through $1.2500 (the series of January and February highs), while the 2008 downtrend intersects at $1.2520 and a weekly close through here would be particularly bullish.

