Gold stabilizes after nonfarm payrolls; near record levels

Decision Moose is a proprietary asset allocation and market timing signal provided to internet users for free. The model has historical trades dating to August 1996. The site has also been independently reviewed by CXO and the historical returns for Decision Moose is impressive. Perhaps the most impressive aspect of Decision Moose besides its historical results are the low turnover - the model is updated/checked weekly, but trades in 2010 totaled 7 and this year there have only been 3 trades.
The model makes its investment decisions based on asset class momentum, monetary policy, and overall market indicators. The model is long-only and invests 100% of its capital to one fund at a time. It evaluates nine index funds to determine which one to invest in, with the nine funds listed below:
Cash or Money Market Fund (3 month Treasury)
Long-term zero-coupon Treasury bonds (BTTRX)
Large cap US stocks (SPY)
Small cap US stocks (IWM)
Gold Bullion (GLD)
Europe 350 stocks (IEV)
Latin America 40 stocks (ILF)
Japan stocks (EWJ)
Pacific ex-Japan stocks (EPP)
The current holding as of 11/18/11 is Long Treasury Bonds (BTTRX).
How To Trade Market Sentiment
I decided to to look at this portfolio using just relative strength. This is not an attempt to unveil or decode Decision Moose's proprietary model since I am making no consideration for monetary conditions or other market indicators. Rather, I wanted to see how a strictly momentum based model of the Moose portfolio performed historically.
ETF Replay was used to test the portfolio in a variety of manners. I had to make two adjustments to the portfolio in order to backtest the portfolio - TLT was substituted for BTTRX and SHY was substituted for 3 month treasuries. Another limitation to this test is GLD did not begin trading until 2004 - Decision Moose used a closed-end fund, ASA, for gold prior to GLD's inception. ASA is not in ETF Replay's historical database.
First, I tested the portfolio to 2003 using the 6 month relative performance to determine a single holding and rebalanced monthly. The results are below:
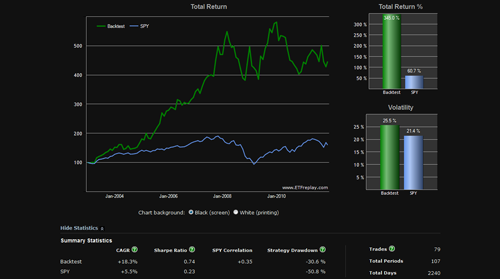
The current holding using 6 month relative strength is TLT.
If we perform the same exact test using 3 month relative strength, holding the top fund and re-balancing monthly performed as follows:
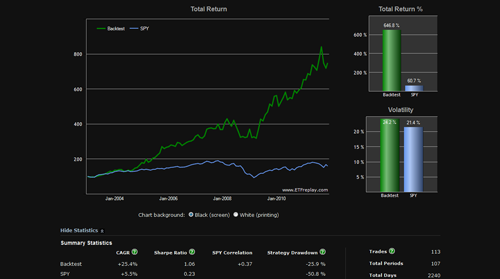
The current holding using the 3 month relative strength signal is TLT.
Next, if we test a strategy using the 6 month returns weighted 40%, 3 month returns weighted 30%, and 3 month volatility weighted at 30% (I refer to this as "6/3/3"), the Moose Portfolio performance is below. For more background on how this "6/3/3" strategy works, I provide background on my Internet Portfolio which I update and track monthly for free on Scott's Investments:

The volatility is lower in this test and the equity curve shows less peaks and valleys than the first two tests. TLT is also the current holding in this strategy.
Finally, if we test a strategy using the 3 month returns weighted 40%, 20 month returns weighted 30%, and 20 month volatility weighted at 30% ("3/20/20"), the Moose Portfolio performs as follows:
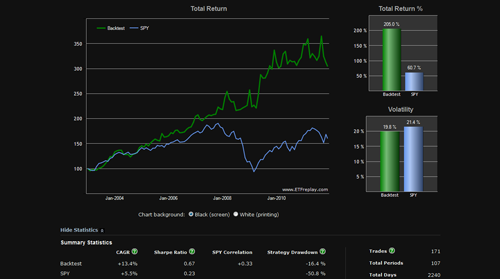
The 3/20/20 strategy has stalled somewhat in the past 2 years but still shows impressive returns at lower volatility compared to SPY. It is evident from all four strategies and Decision Moose that long-term treasuries, at least for the time being, is the asset-class showing favorable risk/return.
The full trade history of the 6/3/3 strategy is below:
Start Date End Date Portfolio Return Bench Return
12/31/02 01/31/03 ILF -4.54% -2.46%
01/31/03 02/28/03 TLT 3.10% -1.35%
02/28/03 03/31/03 TLT -1.36% 0.21%
03/31/03 04/30/03 EPP 4.16% 8.46%
04/30/03 05/30/03 ILF 3.69% 5.48%
05/30/03 06/30/03 ILF 2.78% 1.07%
06/30/03 07/31/03 ILF 3.44% 1.80%
07/31/03 08/29/03 ILF 4.72% 2.06%
08/29/03 09/30/03 EPP 3.84% -1.09%
09/30/03 10/31/03 ILF 6.01% 5.35%
10/31/03 11/28/03 EPP -0.80% 1.09%
11/28/03 12/31/03 ILF 10.86% 5.03%
12/31/03 01/30/04 ILF -0.53% 1.98%
01/30/04 02/27/04 IEV 3.31% 1.36%
02/27/04 03/31/04 EPP -0.32% -1.32%
03/31/04 04/30/04 EWJ -6.71% -1.89%
04/30/04 05/28/04 IEV 1.98% 1.71%
05/28/04 06/30/04 EWJ 6.31% 1.85%
06/30/04 07/30/04 IEV -3.79% -3.22%
07/30/04 08/31/04 TLT 4.16% 0.24%
08/31/04 09/30/04 TLT 0.95% 1.00%
09/30/04 10/29/04 ILF 2.37% 1.29%
10/29/04 11/30/04 EPP 7.29% 4.45%
11/30/04 12/31/04 EPP 4.20% 3.02%
12/31/04 01/31/05 EPP -0.47% -2.24%
01/31/05 02/28/05 EPP 4.22% 2.09%
02/28/05 03/31/05 EPP -3.69% -1.83%
03/31/05 04/29/05 EPP 0.77% -1.87%
04/29/05 05/31/05 TLT 3.14% 3.22%
05/31/05 06/30/05 TLT 2.16% 0.15%
06/30/05 07/29/05 TLT -3.38% 3.83%
07/29/05 08/31/05 SPY -0.94% -0.94%
08/31/05 09/30/05 ILF 15.62% 0.80%
09/30/05 10/31/05 ILF -4.16% -2.37%
10/31/05 11/30/05 EWJ 2.89% 4.40%
11/30/05 12/30/05 ILF 1.24% -0.19%
12/30/05 01/31/06 EWJ 3.70% 2.40%
01/31/06 02/28/06 ILF -1.07% 0.57%
02/28/06 03/31/06 ILF -1.81% 1.65%
03/31/06 04/28/06 GLD 12.03% 1.26%
04/28/06 05/31/06 GLD -1.32% -3.01%
05/31/06 06/30/06 IEV 0.72% 0.26%
06/30/06 07/31/06 IEV 1.97% 0.45%
07/31/06 08/31/06 SHY 0.75% 2.18%
08/31/06 09/29/06 IEV 0.67% 2.70%
09/29/06 10/31/06 TLT 0.85% 3.15%
10/31/06 11/30/06 SPY 1.99% 1.99%
11/30/06 12/29/06 EPP 4.41% 1.33%
12/29/06 01/31/07 EPP 1.57% 1.50%
01/31/07 02/28/07 EPP 0.63% -1.96%
02/28/07 03/30/07 EPP 4.95% 1.16%
03/30/07 04/30/07 EPP 3.90% 4.43%
04/30/07 05/31/07 EPP 3.09% 3.39%
05/31/07 06/29/07 ILF 1.39% -1.46%
06/29/07 07/31/07 ILF 0.57% -3.13%
07/31/07 08/31/07 SHY 1.05% 1.28%
08/31/07 09/28/07 SHY 0.55% 3.87%
09/28/07 10/31/07 GLD 6.95% 1.36%
10/31/07 11/30/07 GLD -1.65% -3.87%
11/30/07 12/31/07 GLD 6.65% -1.13%
12/31/07 01/31/08 TLT 2.10% -6.05%
01/31/08 02/29/08 GLD 5.23% -2.58%
02/29/08 03/31/08 GLD -6.00% -0.90%
03/31/08 04/30/08 GLD -4.16% 4.77%
04/30/08 05/30/08 ILF 8.70% 1.51%
05/30/08 06/30/08 ILF -7.61% -8.35%
06/30/08 07/31/08 SHY 0.43% -0.90%
07/31/08 08/29/08 SHY 0.47% 1.55%
08/29/08 09/30/08 TLT 1.47% -9.44%
09/30/08 10/31/08 TLT -1.86% -16.52%
10/31/08 11/28/08 SHY 1.10% -6.96%
11/28/08 12/31/08 TLT 13.64% 0.98%
12/31/08 01/30/09 TLT -13.07% -8.21%
01/30/09 02/27/09 TLT -1.54% -10.74%
02/27/09 03/31/09 GLD -2.54% 8.35%
03/31/09 04/30/09 SHY -0.16% 9.93%
04/30/09 05/29/09 EPP 15.48% 5.85%
05/29/09 06/30/09 ILF -2.45% -0.07%
06/30/09 07/31/09 ILF 8.46% 7.46%
07/31/09 08/31/09 EPP 3.53% 3.69%
08/31/09 09/30/09 EPP 9.69% 3.55%
09/30/09 10/30/09 EPP -2.32% -1.92%
10/30/09 11/30/09 GLD 12.79% 6.16%
11/30/09 12/31/09 GLD -7.20% 1.91%
12/31/09 01/29/10 ILF -10.82% -3.63%
01/29/10 02/26/10 GLD 3.27% 3.12%
02/26/10 03/31/10 SPY 6.09% 6.09%
03/31/10 04/30/10 IWM 5.67% 1.55%
04/30/10 05/28/10 IWM -7.54% -7.95%
05/28/10 06/30/10 TLT 5.80% -5.17%
06/30/10 07/30/10 TLT -0.95% 6.83%
07/30/10 08/31/10 TLT 8.40% -4.50%
08/31/10 09/30/10 TLT -2.51% 8.96%
09/30/10 10/29/10 GLD 3.68% 3.82%
10/29/10 11/30/10 GLD 2.11% 0.00%
11/30/10 12/31/10 GLD 2.44% 6.68%
12/31/10 01/31/11 IWM -0.37% 2.33%
01/31/11 02/28/11 IWM 5.54% 3.47%
02/28/11 03/31/11 SPY 0.01% 0.01%
03/31/11 04/29/11 SPY 2.90% 2.90%
04/29/11 05/31/11 GLD -1.79% -1.12%
05/31/11 06/30/11 GLD -2.43% -1.69%
06/30/11 07/29/11 GLD 8.42% -2.00%
07/29/11 08/31/11 GLD 12.27% -5.50%
08/31/11 09/30/11 GLD -11.06% -6.94%
09/30/11 10/31/11 TLT -3.84% 10.91%
10/31/11 11/21/11 TLT 3.86% -4.65%
For those interested in the history of Decision Moose trades, the full history is below:
DATE ACTION PORTFOLIO
LATEST HOLD Long Bonds (BTTRX) $1,053,280
09.30.2011 Switch to Long Bonds (BTTRX) $1,063,946
09.23.2011 Switch to Cash (3moT) $1,063,944
04.29.2011 Switch to Gold (GLD) $1,014,475
12.03.2010 Switch to US Small-cap Equities (IWM) $888,590
11.26.2010 Switch to Cash (3moT) $888,568
10.15.2010 Switch to Pacific ex-Japan (EPP) $925,500
07.02.2010 Switch to Long Bonds (BTTRX) $880,370
05.07.2010 Switch to Gold (GLD) $878,736
03.05.2010 Switch to US Small-cap Equities (IWM) $895,676
01.22.2010 Switch to Cash (3moT) $895,572
11.06.2009 Switch to Latin American Equities (ILF) $932,139
10.30.2009 Switch to Cash (3moT) $932,131
10.16.2009 Switch to Latin American Equities (ILF) $1,013,505
07.24.2009 Switch to Pacific ex-Japan (EPP) $817,451
04.10.2009 Switch to Cash (3moT) $817,082
02.06.2009 Switch to Gold (GLD) $848,133
11.28.2008 Switch to Long Bonds (BTTRX) $904,527
09.26.2008 Switch to Cash (3moT) $903,981
08.29.2008 Switch to Long Bonds (BTTRX) $902,582
03.21.2008 Switch to Cash (3moT) $896,170
11.23.2007 Switch to Gold (GLD) $809,853
11.09.2007 Switch to Cash (3moT) $808,852
10.05.2007 Switch to Latin American Equities (ILF) $807,409
08.10.2007 Switch to Cash (3moT) $802,658
04.13.2007 Switch to Latin American Equities (ILF) $747,629
03.09.2007 Switch to Pacific ex-Japan (EPP) $672,465
03.02.2007 Switch to Cash (3moT) $671,826
11.03.2006 Switch to Latin American Equities (ILF) $645,352
08.18.2006 Switch to European Equities (IEV) $615,174
06.09.2006 Switch to Cash (3moT) $609,415
04.07.2006 Switch to Gold Bullion (GLD) $590,664
01.27.2006 Switch to Latin American Equities (ILF) $586,785
12.30.2005 Switch to Japan Equity Index (EWJ) $561,056
11.05.2005 Switch to Latin American Equities (ILF) $537,307
10.07.2005 Switch to Cash (3moT) $535,744
08.26.2005 Switch to Long Bonds (BTTRX) $552,712
08.05.2005 Switch to Cash (3moT) $551,615
06.17.2005 Switch to Latin American Equities (ILF) $508,790
05.20.2005 Switch to Long Bonds (BTTRX) $501,161
03.24.2005 Switch to Cash (3moT) $499,023
11.12.2004 Switch to Latin American Equities (ILF) $446,568
08.06.2004 Switch to Long Bonds (BTTRX) $423,727
03.26.2004 Switch to Cash (3moT) $421,967
01.10.2004 Switch to Long Bonds (BTTRX) $396,007
01.03.2004 Switch to Cash (3moT) $395,943
07.19.2003 Switch to Asian Equities (SAF) $270,011
02.08.2003 Switch to Long Bonds (BTTRX) $264,386
01.04.2003 Switch to Gold Shares (ASA) $278,513
06.15.2002 Switch to Long Bonds (BTTRX) $251,855
06.01.2002 Switch to Cash (3moT) $251,685
11.24.2001 Switch to Gold Shares (ASA) $129,198
07.28.2001 Switch to Long Bonds (BTTRX) $127,541
01.27.2001 Switch to Gold Shares (ASA) $117,381
05.07.2000 Switch to Long Bonds (BTTRX) $100,000
ETFs Replace Mutual Funds
05.07.2000 Close Invesco Europe $275,417
01.21.2000 Switch to Invesco Europe $266,459
07.08.1999 Switch to Invesco Pacific $214,552
04.23.1999 Switch to Invesco Latin America $207,312
11.13.1998 Switch to Schwab S&P Index $173,557
08.02.1998 Switch to Long Bonds (BTTRX) $167,647
03.06.1998 Switch to Invesco Europe $150,516
11.07.1997 Switch to Schwab S&P Index $135,842
08.15.1997 Switch to Schwab Small Cap Index $126,667
07.25.1997 Switch to Schwab S&P Index $131,642
02.21.1997 Switch to Invesco Latin America $113,804
12.27.1996 Switch to Schwab S&P Index $107,364
11.15.1996 Switch to Long Bonds (BTTRX) $108,242
10.04.1996 Switch to Schwab S&P Index $102,881
08.30.1996 Buy Invesco Latin America $100,000