
Telefonica (MC:TEF), S.A. (NYSE:TEF) reported unimpressive fourth-quarter 2019 results, with the top line declining on a year-over-year basis. The company’s shares fell 1.48% in yesterday’s trading session to close at $6.75.
Net Loss
In the December quarter, the Spanish telecom giant’s net loss was €202 million or a loss of €0.05 per share ($223.6 million or 6 cents per share) against net income of €610 million or €0.11 per share in the year-ago quarter. In 2019, net income plunged 65.7% year over year to €1,142 million or €0.17 per share. On an adjusted basis, fourth-quarter net income per share came in at €0.18 (20 cents).
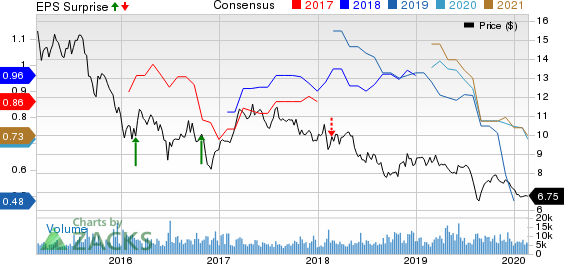
Telefonica SA Price, Consensus and EPS Surprise
Revenues
Quarterly aggregate revenues declined 4% year over year to €12,400 million ($13,728.3 million) due to changes in the perimeter and the effect of currency depreciation. However, organic revenues moved up 2% year over year on the back of sustained service revenue growth and handset sales. In 2019, revenues inched down 0.6% year over year to €48,422 million.
Quarterly Results by Business Units
Telefonica Espana: Revenues in Spain inched up 0.4% year over year on a reported basis to €3,266 million ($3,615.9 million), driven by service revenue growth. OIBDA margin was 41.9% compared with 29.7% in the year-ago quarter, which reflects improved operating expenses.
Telefonica Deutschland: Revenues climbed 0.2% to €1,970 million ($2,181 million) backed by the performance of the O2 Free portfolio, further easing of legacy base headwinds partly offset by ongoing regulatory impacts and a slight decline in handset sales. OIBDA margin was 31.9% compared with 24.5% in the year-ago quarter, supported by contribution from improved efficiencies.
Telefonica UK: Revenues increased 4.3% year over year to €1,925 million ($2,131.2 million). This was driven by higher value handset revenues and consistent growth in Smart Metering Implementation Programme (SMIP) as well as MVNO revenues. OIBDA margin was 27% compared with 28.3% in the year-ago quarter, reflecting higher ALFs and adverse year-over-year comparisons.
Telefonica Brasil: Revenues in Brazil declined 2.1% to €2,499 million ($2,131.2 million) primarily due to the decline in voice and DTH, as a result of greater focus on IPTV. OIBDA margin increased to 45.7% from 38.4% owing to a €29 million positive impact from related to the adequacy of international intellectual property.
Telefonica Hispam Sur: Revenues in this segment declined 19.5% to €1,599 million ($1,770.3 million) mainly due to negative regulatory impacts in Chile and Peru. OIBDA margin declined to 8.2% from 24.3%.
Telefonica Hispam Norte: Revenues in the segment fell 11.7% year over year to €916 million ($1,014.1 million), affected by Ecuador’s macro-economic environment in spite of growth acceleration in Mexico and the return to positive growth in Colombia. OIBDA margin declined to 3.4% from 4.4%.
Other Details
Overall, OIBDA (operating income before depreciation and amortization) came in at €3,669 million, up 3.8% year over year. The upside can be attributed to the impact of IFRS 16 accounting standard. OIBDA margin was 29.6% compared with 27.4% in the year-ago quarter. Operating income was down 14.4% to €914 million.
Cash Flow & Liquidity
In 2019, Telefonica generated €15,022 million of net cash from operating activities compared with €13,423 million in 2018. As of Dec 31, 2019, the company had €6,042 million ($6,775.9 million) in cash and equivalents with €43,288 million ($48,546.3 million) of non-current financial liabilities compared with the respective tallies of €5,692 million and €45,334 million a year ago.
Zacks Rank & Stocks to Consider
Telefonica currently has a Zacks Rank #4 (Sell).
Few better-ranked stocks in the broader sector are PCTEL, Inc. (NASDAQ:PCTI) , Motorola Solutions, Inc. (NYSE:MSI) and Qualcomm Incorporated (NASDAQ:QCOM) . While PCTEL sports a Zacks Rank #1 (Strong Buy), Motorola and Qualcomm carry a Zacks Rank #2 (Buy). You can see the complete list of today’s Zacks #1 Rank stocks here.
PCTEL has trailing four-quarter positive earnings surprise of 150.6%, on average.
Motorola has trailing four-quarter positive earnings surprise of 6.6%, on average.
Qualcomm has trailing four-quarter positive earnings surprise of 10%, on average.
Conversion rate used:
€1 = $1.107119 (period average from Oct 1, 2019 to Dec 31, 2019)
€1 = $1.121473 (as of Dec 31, 2019)
More Stock News: This Is Bigger than the iPhone!
It could become the mother of all technological revolutions. Apple (NASDAQ:AAPL) sold a mere 1 billion iPhones in 10 years but a new breakthrough is expected to generate more than 27 billion devices in just 3 years, creating a $1.7 trillion market.
Zacks has just released a Special Report that spotlights this fast-emerging phenomenon and 6 tickers for taking advantage of it. If you don't buy now, you may kick yourself in 2020.
Click here for the 6 trades >>
Telefonica SA (TEF): Free Stock Analysis Report
QUALCOMM Incorporated (QCOM): Free Stock Analysis Report
Motorola Solutions, Inc. (MSI): Free Stock Analysis Report
PCTEL, Inc. (PCTI): Free Stock Analysis Report
Original post
Zacks Investment Research