
Summary: Technically Speaking For March 4- The trade war with China may be coming to an end.
- Global markets are mostly higher since the beginning of the year.
- Markets were down March 4th. There continues to be a lot of negativity in the charts, although it hasn't resulted in a major selloff.
The trade war with China may be coming to an end. From the NY Times:
The Trump administration is close to a trade deal with China that would roll back tariffs on both sides of the Pacific but may do little to achieve the substantive changes to China’s economy that the United States initially set out to win, people with knowledge of the talks said.
Significant details remain unsettled and the deal is still being discussed but so far, the two sides have agreed on a pact that would largely require Beijing to make big purchases of American agricultural and energy goods and to lower some barriers that prevent American companies from operating in China. In return, the United States would most likely drop its tariffs on at least $200 billion of the $250 billion worth of Chinese imports currently subject to American levies.
There is movement on the forced technology transfer issue, but so far the changes are cosmetic. A new law proposed by the Chinese "legislature" (which largely rubber-stamps the wishes of the communist party) would prevent local and regional governments from demanding the transfer. The national government, however, could still make the request.
Global markets have rebounded since the first of the year:
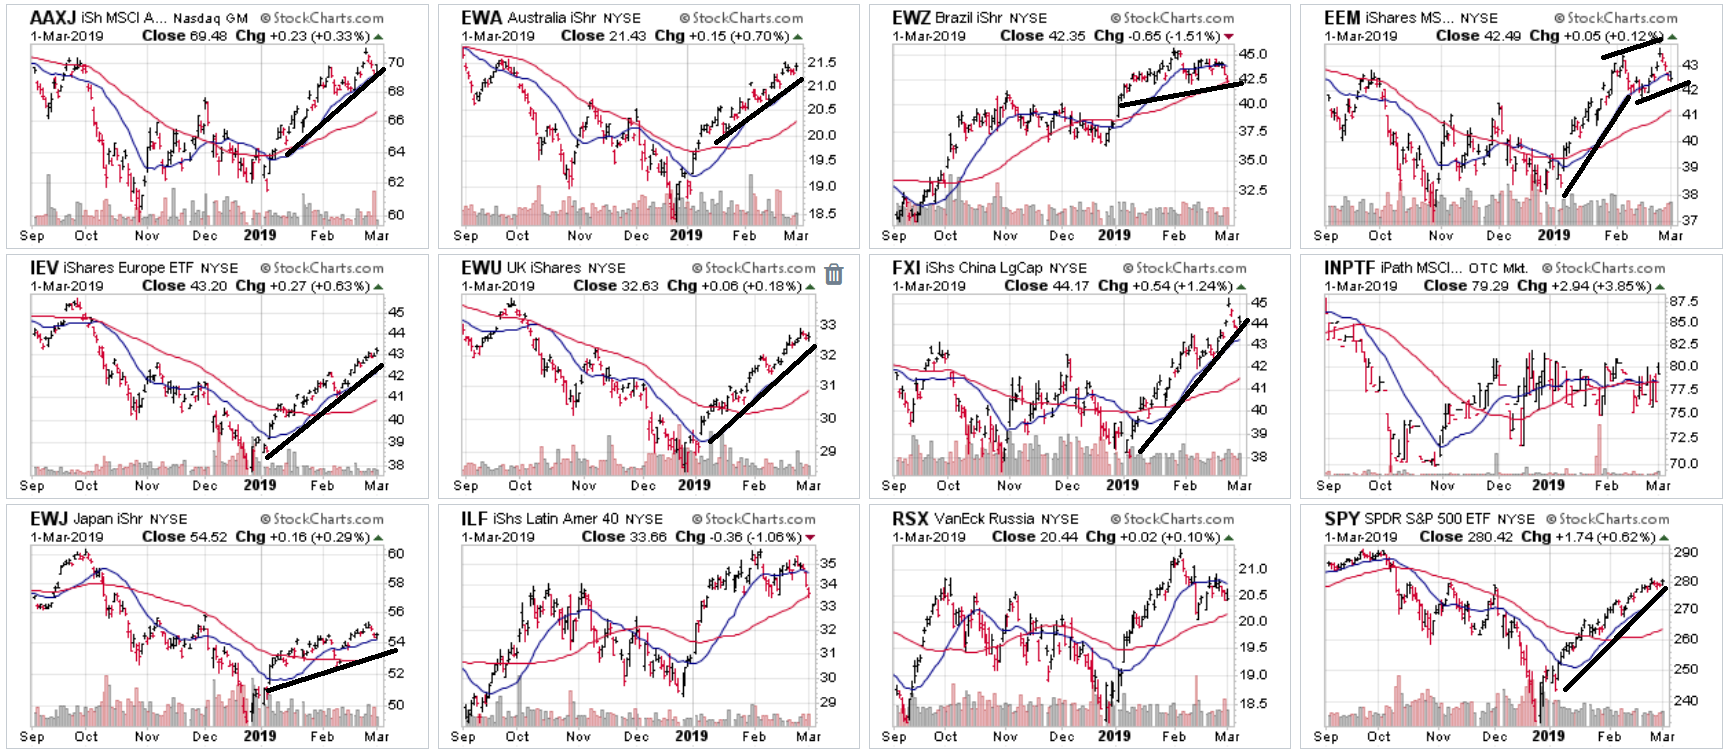
Above is a collection of 6-month charts that show ETFs that track the major global indexes. While we can't conclusively determine if these are new rallies or counter-rallies to last fall's selloffs, recent releases support the latter. GDP growth in China and the EU has been weaker; Japanese exports dropped sharply in the latest report; U.K. growth was negative in December; two U.S. coincidental economic indicators (industrial production and retail sales) declined in the latest reports.
Anti-trust law hasn't really been enforced in the U.S. since the Justice Department's loss to Microsoft (NASDAQ:MSFT). As a result, major tech companies now control large percentages of their respective markets with little fear of a major DOJ case. Now, we're seeing an increasing number of calls for increased regulation on these companies, with the latest being a Glass-Steagall-style law that would separate tech companies into sub-entities. This idea is just being floated; it's highly doubtful to get through the Republican-controlled Senate. Nevertheless, it marks the continued push for additional rules for a key economic sector.
The markets were lower today. The IWM was off .92 while the DIA dropped .81. Treasuries were higher. Real estate and basic materials were the top gaining sectors (up .44 and .40, respectively) while health care and financials led the market lower.
The charts were, once again, concerning.
The markets gapped higher at the open but then sold off until early afternoon. The drop was strong and fairly pronounced. Prices rebounded in the afternoon, moving higher in two moves. However, the SPY (NYSE:SPY) was still off for the day.
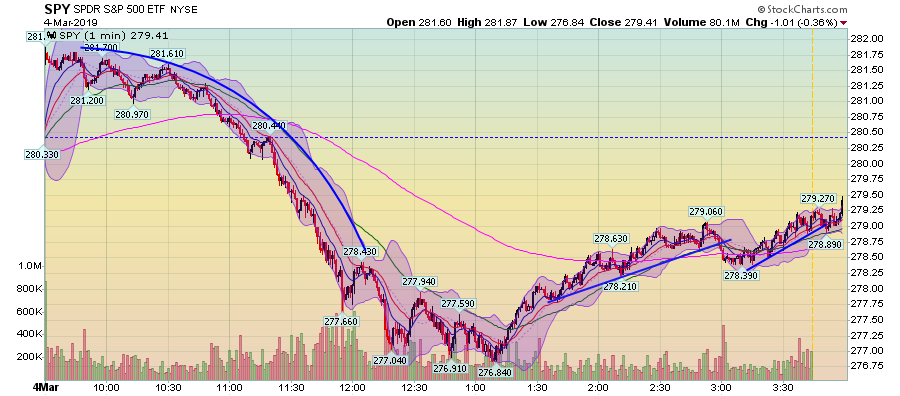
There's a lot of bearishness on the 5-day chart:
There have been eight downtrends (seven if you combine the end-of-trading move lower on Tuesday afternoon with Wednesday morning's sell-off) in the last five days. The good news is there have been two end-of-the-session rallies in the last two days. But right now, traders are more likely to pull the trigger on a sell than issue a buy order.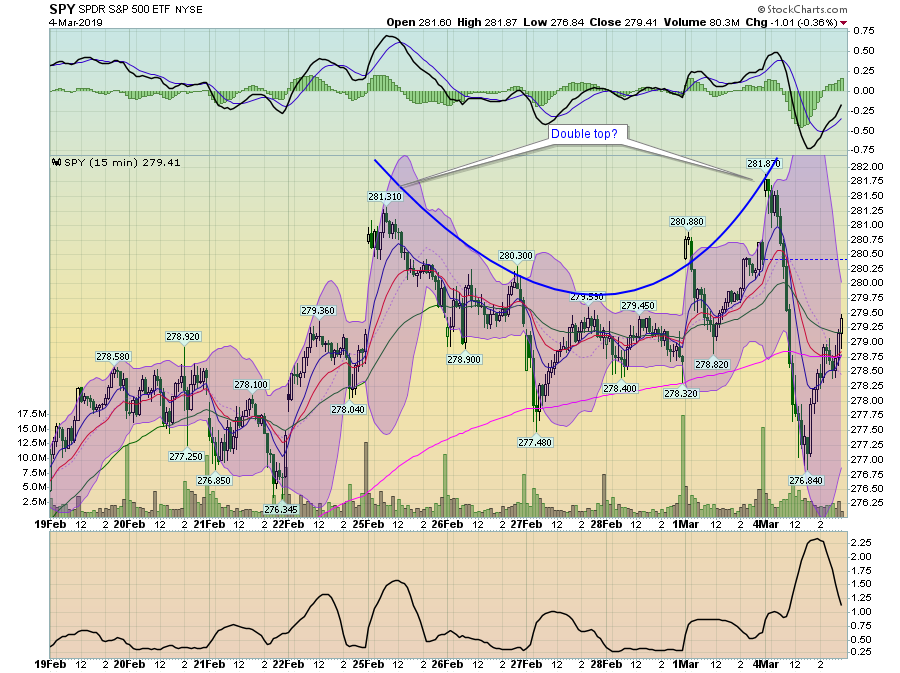
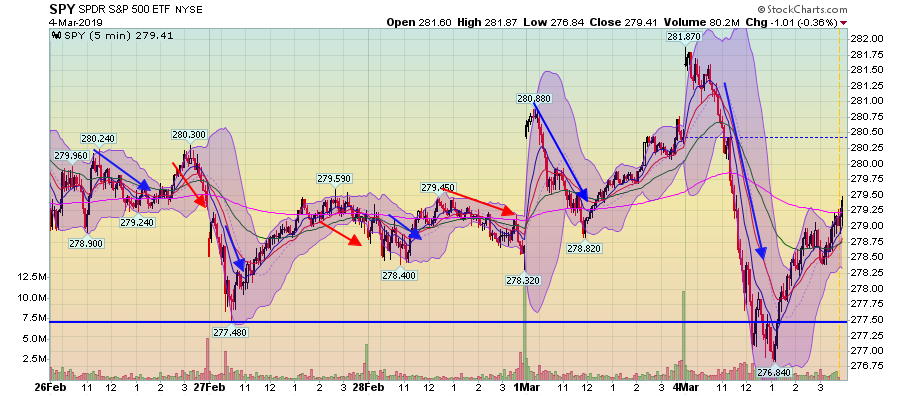
There is a double-top on the two-week chart, which might signal an end of the recent rally.
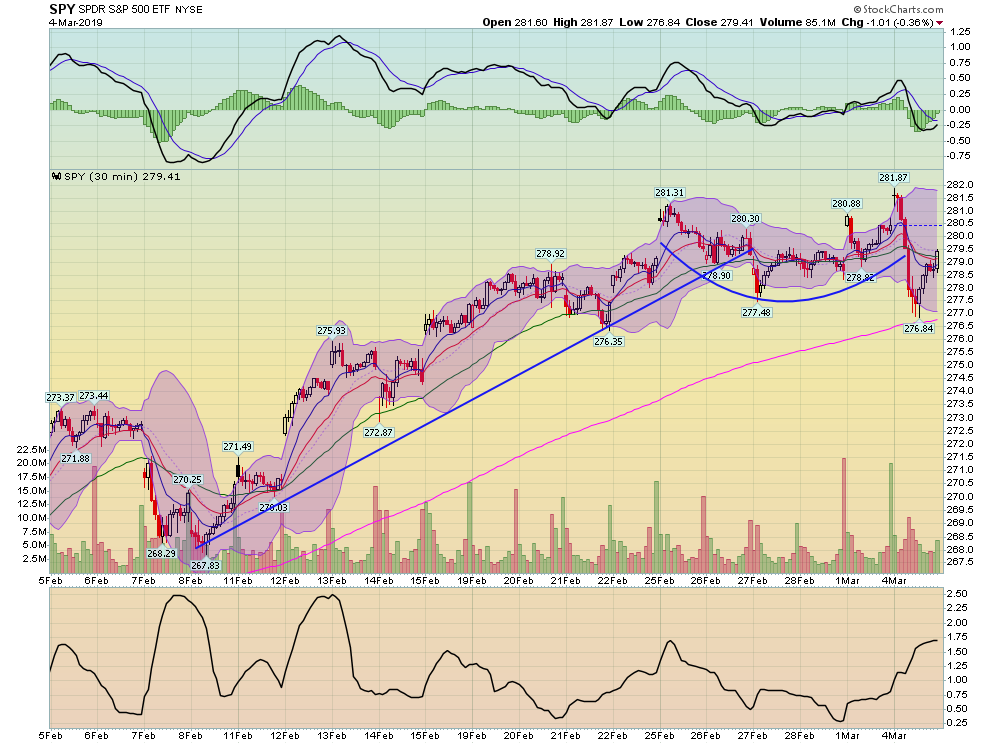
The 30-day SPY chart puts the double-top theory into sharper focus.
And, there are many broken uptrends on the 30-minute charts of larger economic sector ETFs:
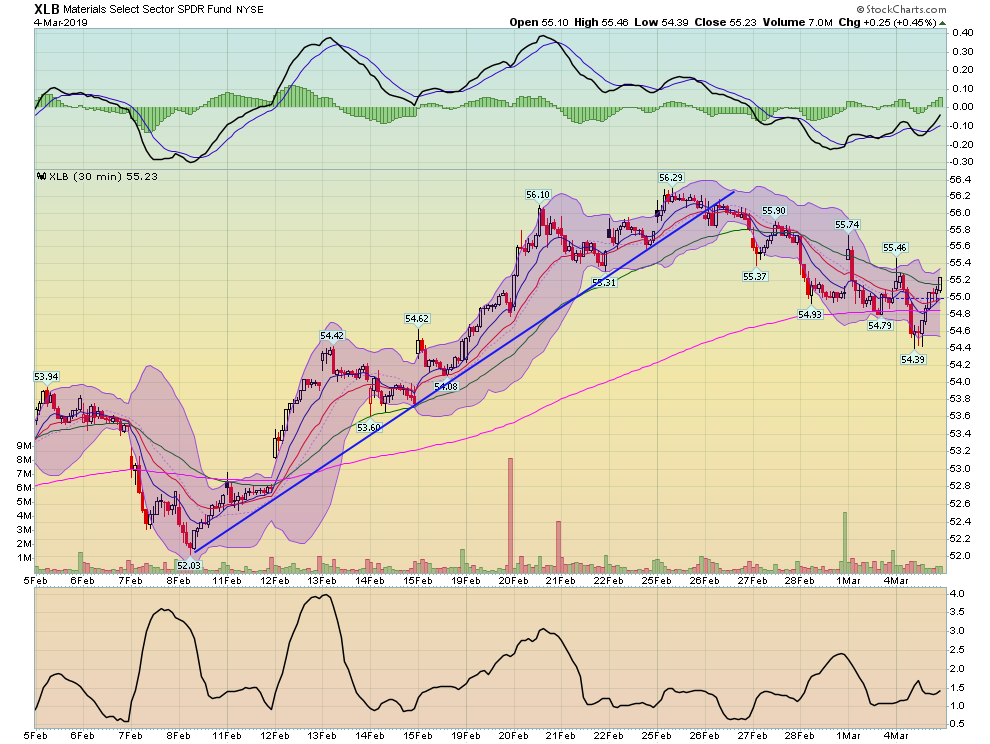
The basic materials sector rallied from February 8-25, rising about 6%. Since then, the ETF has been trending lower, finding support at the 200-minute EMA.
The energy ETF rallied from February 8-20, gaining 8%. Since then, prices have been consolidating sideways.
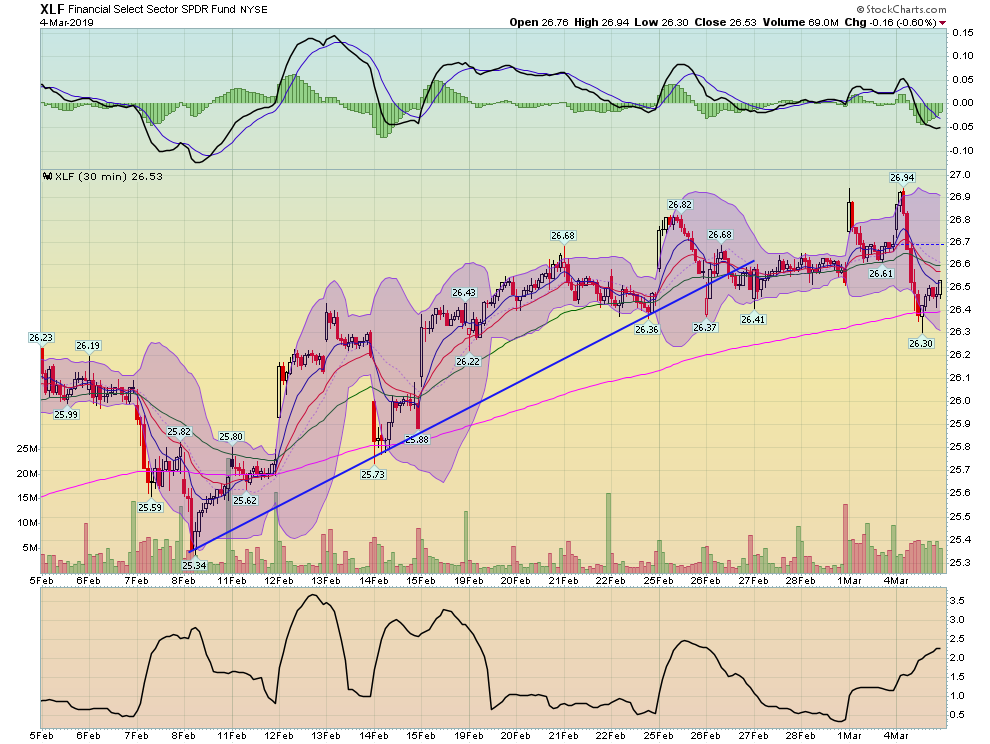
The financial sector ETF gained 5.5% between February 8 and 26. It's been moving sideways for the last four days.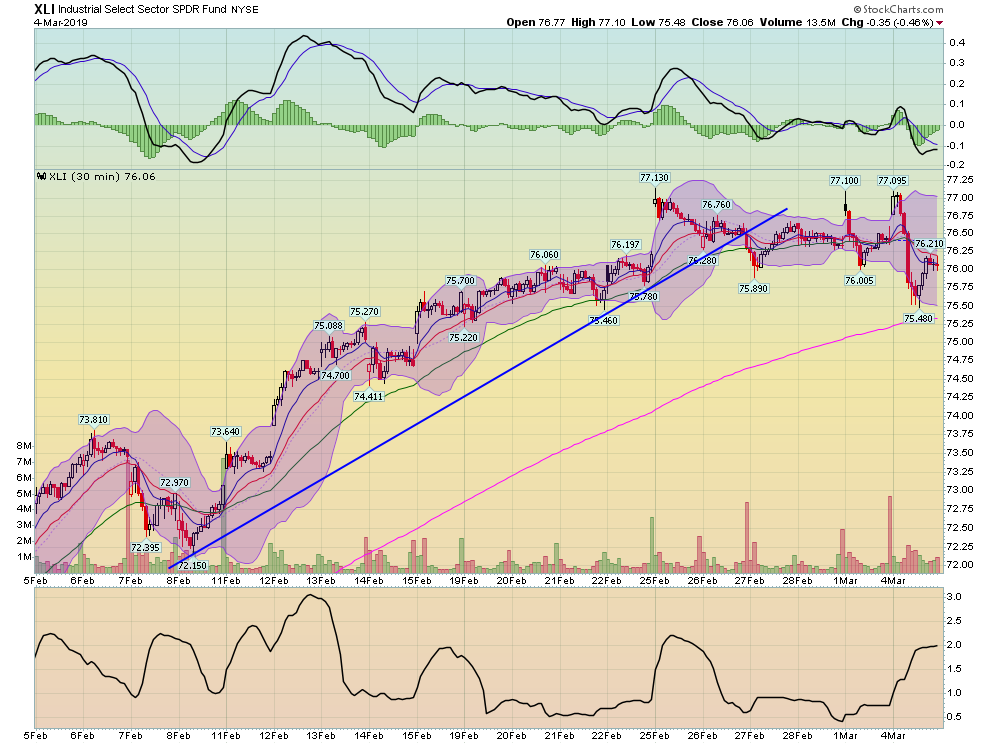
After gaining 7% between February 8-26, the industrial sector ETF has been moving sideways, consolidating gains.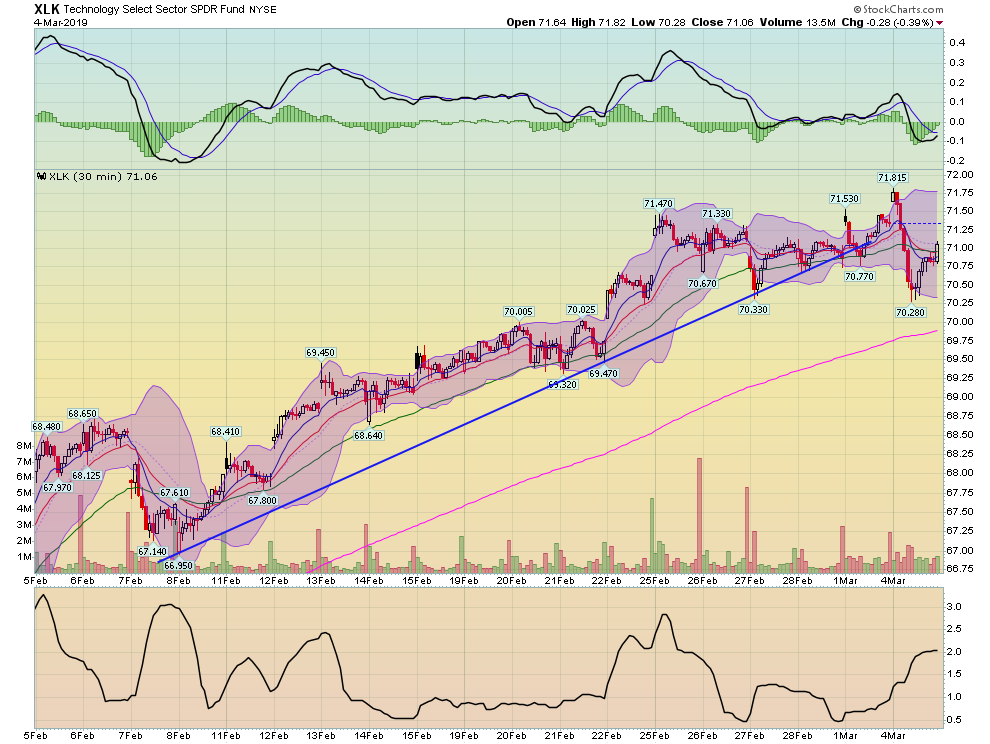
The technology sector gained 7% between February 8-March 1. It broke its trend today.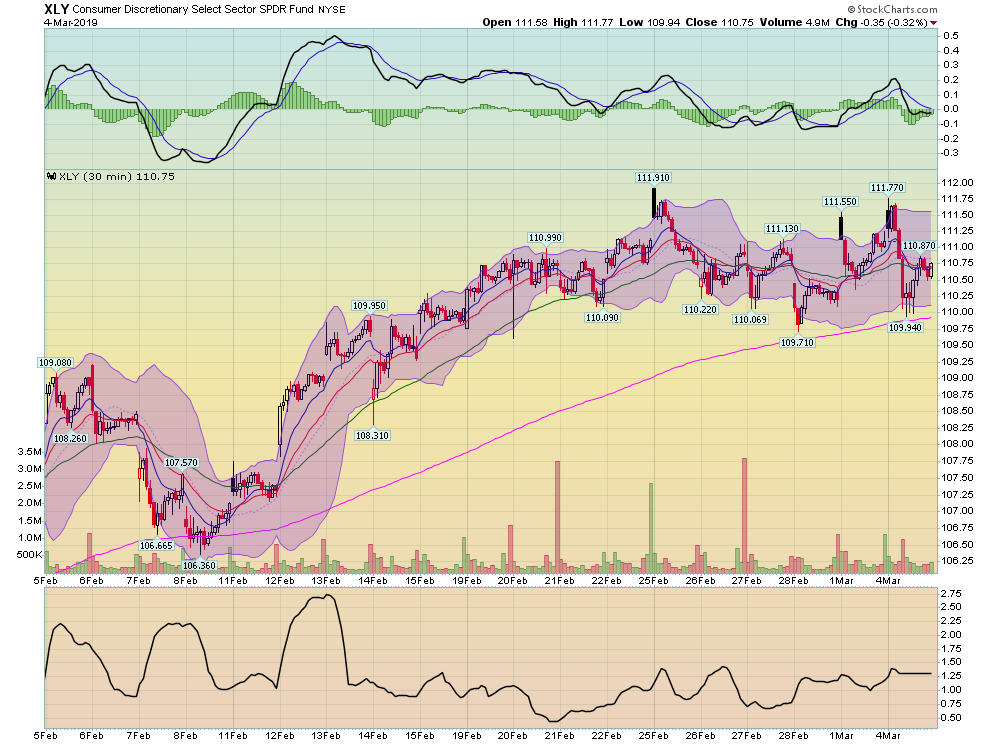
The consumer discretionary sector is also consolidating gains after rising 5% in February.
Only a few more trading days will determine if today's sharp morning selloff is a precursor of an additional move lower. However, the combined reading of the above charts is that that markets want to move lower; they may simply need a new catalyst.
Disclosure: I/we have no positions in any stocks mentioned, and no plans to initiate any positions within the next 72 hours. I wrote this article myself, and it expresses my own opinions. I am not receiving compensation for it (other than from Seeking Alpha). I have no business relationship with any company whose stock is mentioned in this article.