Breaking News
Investing Pro 0
Cyber Monday Deal: Up to 55% off CLAIM SALE

Technically Speaking For December 17

By Hale StewartETFsDec 17, 2018 11:56PM ET
www.investing.com/analysis/technically-speaking-for-december-17-200368940
Technically Speaking For December 17
By Hale Stewart   |  Dec 17, 2018 11:56PM ET
Saved. See Saved Items.
This article has already been saved in your Saved Items
 
 
DJI
+0.24%
Add to/Remove from Watchlist
Add to Watchlist
Add Position

Position added successfully to:

Please name your holdings portfolio
 
QQQ
+0.26%
Add to/Remove from Watchlist
Add to Watchlist
Add Position

Position added successfully to:

Please name your holdings portfolio
 
JNJ
+0.26%
Add to/Remove from Watchlist
Add to Watchlist
Add Position

Position added successfully to:

Please name your holdings portfolio
 
CL
+1.79%
Add to/Remove from Watchlist
Add to Watchlist
Add Position

Position added successfully to:

Please name your holdings portfolio
 
IWM
-0.40%
Add to/Remove from Watchlist
Add to Watchlist
Add Position

Position added successfully to:

Please name your holdings portfolio
 
NYA
-0.01%
Add to/Remove from Watchlist
Add to Watchlist
Add Position

Position added successfully to:

Please name your holdings portfolio
 

Summary

  • The high-yield market's problems are continuing
  • Retail stocks are selling off
  • At a time when the bulls could really use some good news, they didn't get any

According to the Financial Times, the high-yield market is "drying up."

Investment banks are having a difficult time finding buyers for leveraged loans, leading to the postponement of a number of deals until after the first of the year. Yields in the high-yield market continue to move higher:
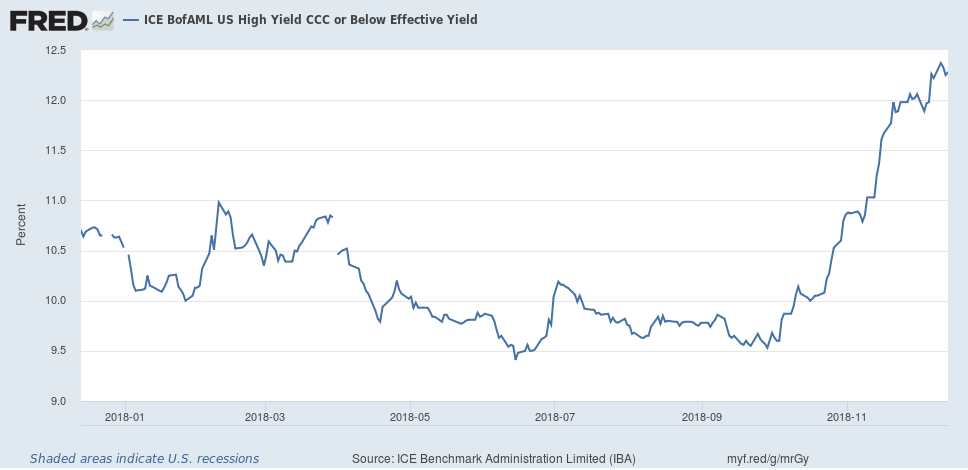
US High Yield CCC, M

The CCC market rose over 200 basis points over the last few months. It looked like the market had crested in mid-November, but rates continued to climb in early December. Overall, rates are now at their highest level since the oil price-caused blow-out of 2015-2016:
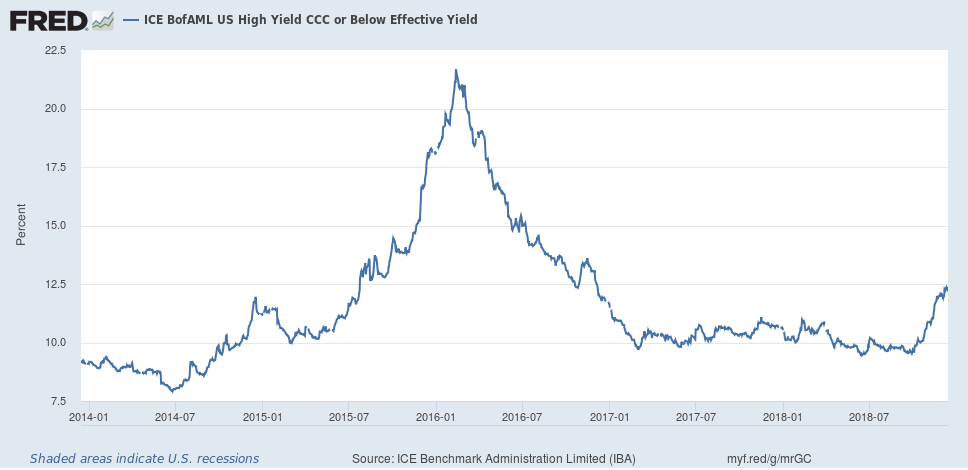
US High Yield CCC, Y

This is a standard, end-of-the-economic-cycle development.

Despite a positive retail sales report on Friday, the market is selling retail stocks.

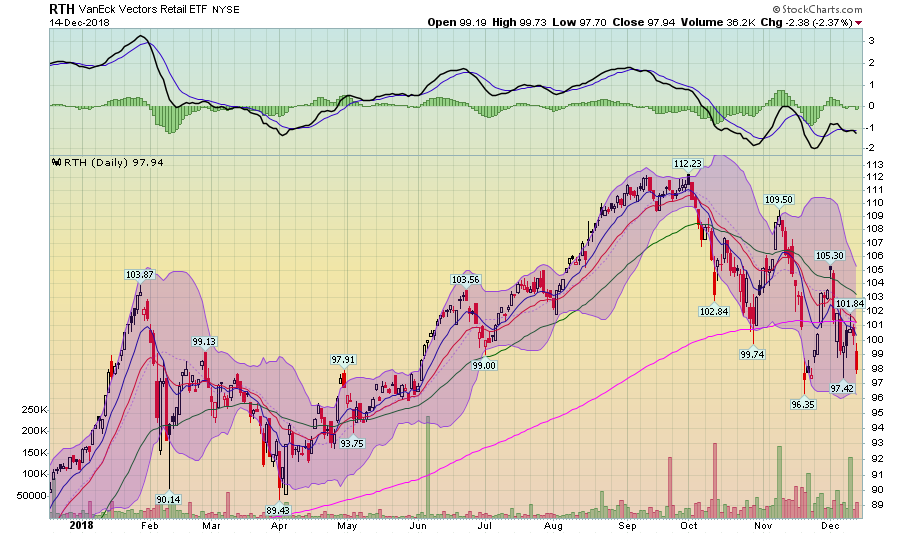
The Consumer Discretionary (NYSE:RXI) is trading near a 52-week low. Other retail stocks are also falling. The VanEck Vectors Retail ETF (NYSEARCA:RTH) -- the ETF that tracks retail stocks -- is in a clear downtrend:
VanEck Vectors Retail ETF

The ETF peaked at 112.23 at the beginning of October. It has been moving consistently lower since printing a continuing series of lower lows and lower highs. Prices are now below all the EMAs. The 10-day EMA has moved below the 200-day EMA; the 20-day will soon follow. Department stores are also falling:
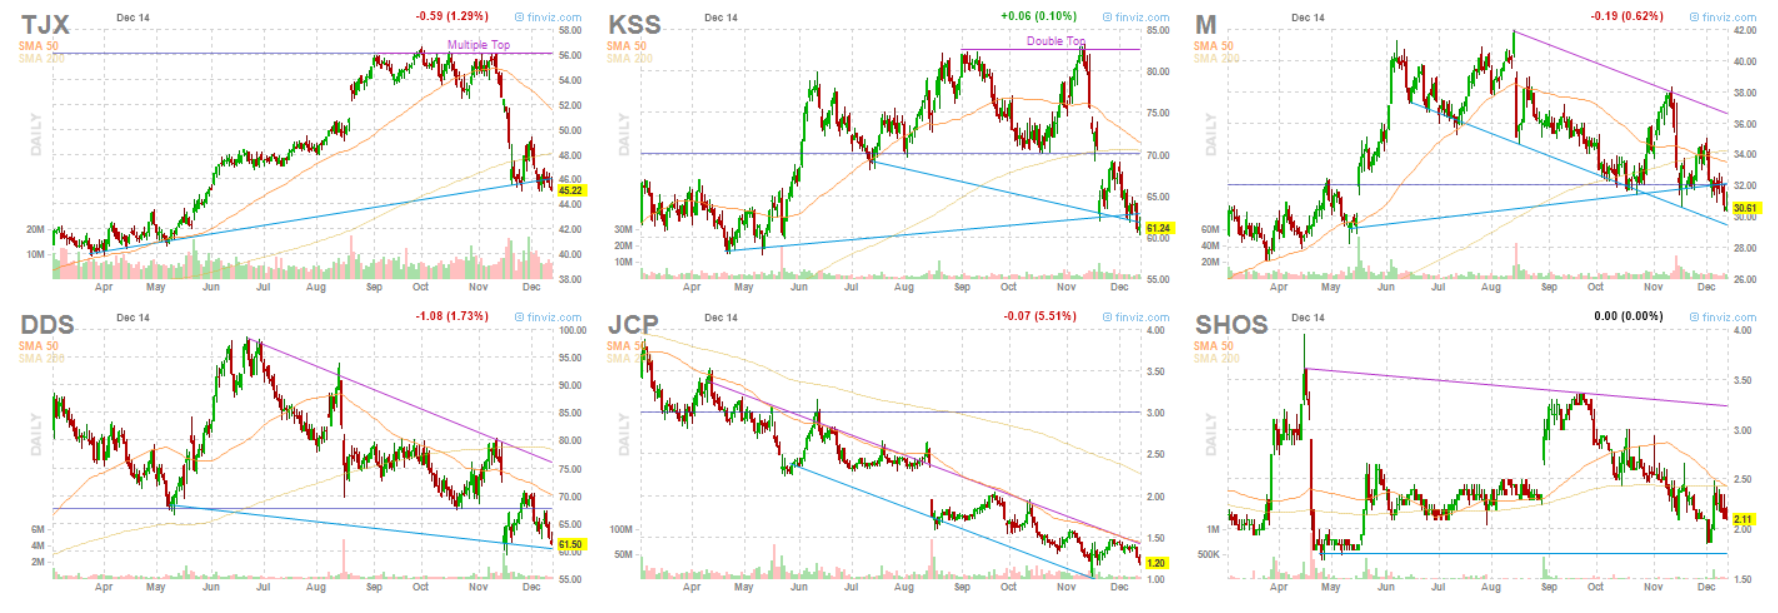
6 Department Stores
6 Department Stores

The six major stores are all technically weak. The timing of this sell-off -- at the height of the holiday shopping season -- is particularly telling.

The market's underlying technicals are deteriorating.

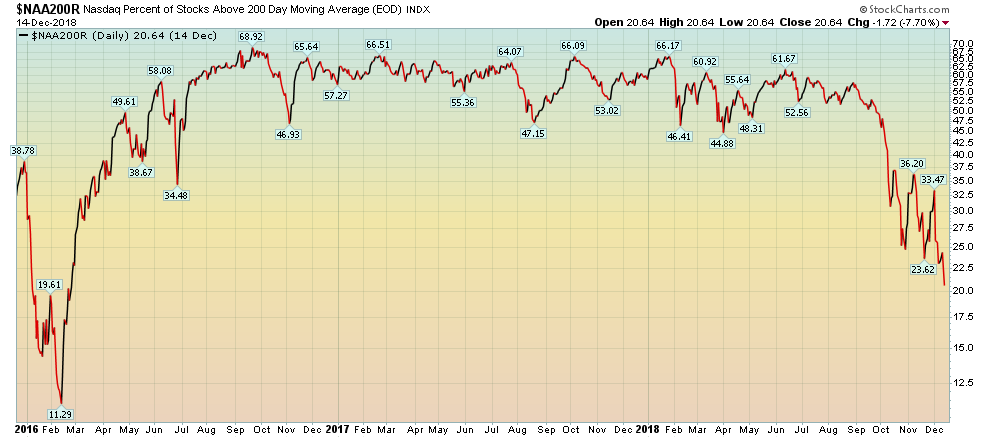
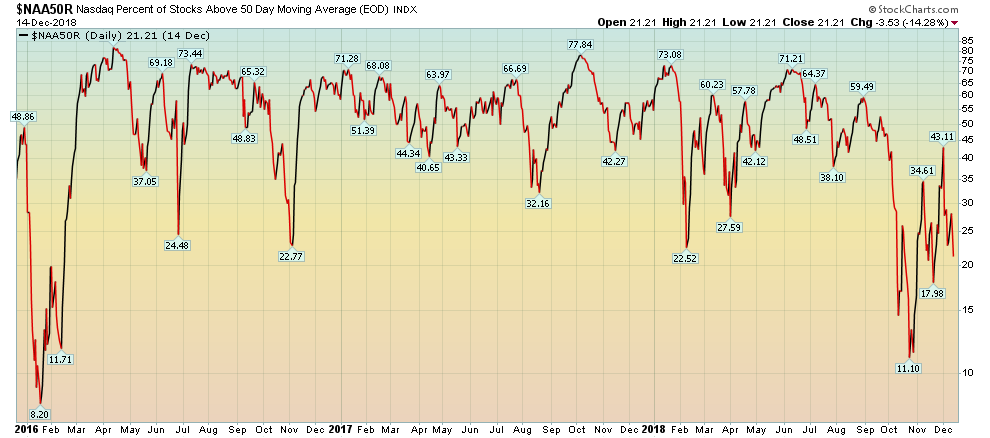
Let's start with the percentage of Nasdaq) stocks above their respective 50 and 200-day EMAs:
Nasdaq Percent Of Stocks Above 50 Day Moving Average

Nasdaq Percent Of Stocks Above 200 Day Moving Average

Both are right above 20% -- a very low level. We see the same thing for the NYSE:

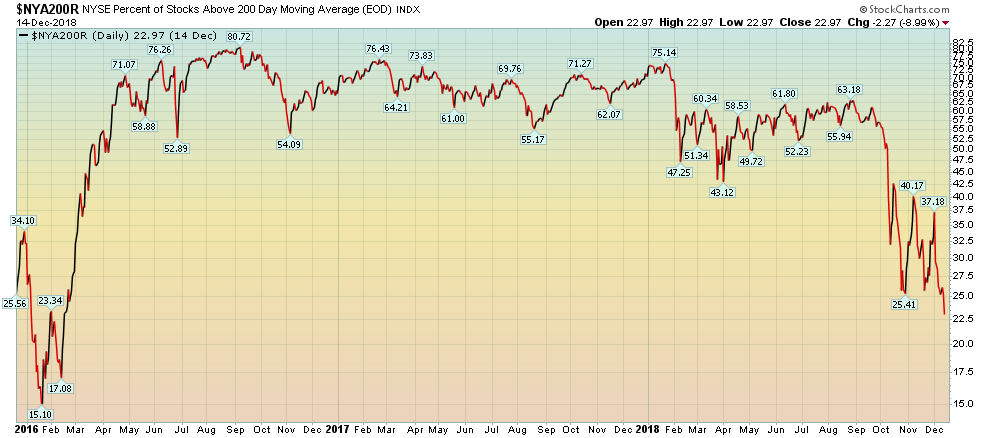
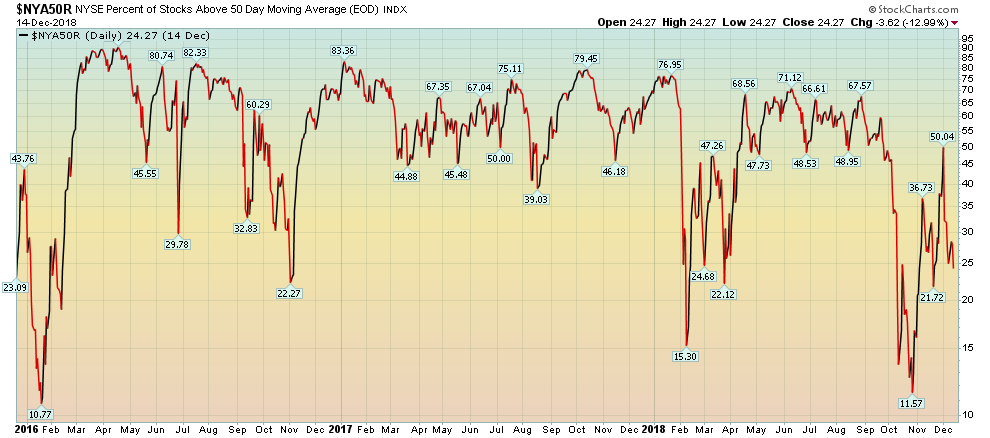
NYSE Percent Of Stocks Above 50 Day Moving Average
NYSE Percent Of Stocks Above 200 Day Moving Average

Both are also in the low 20% range. In other times during this "most hated rally in history," we'd be in classic "buy the dip" territory. However, the current bearish state of the market means these are very worrying numbers.

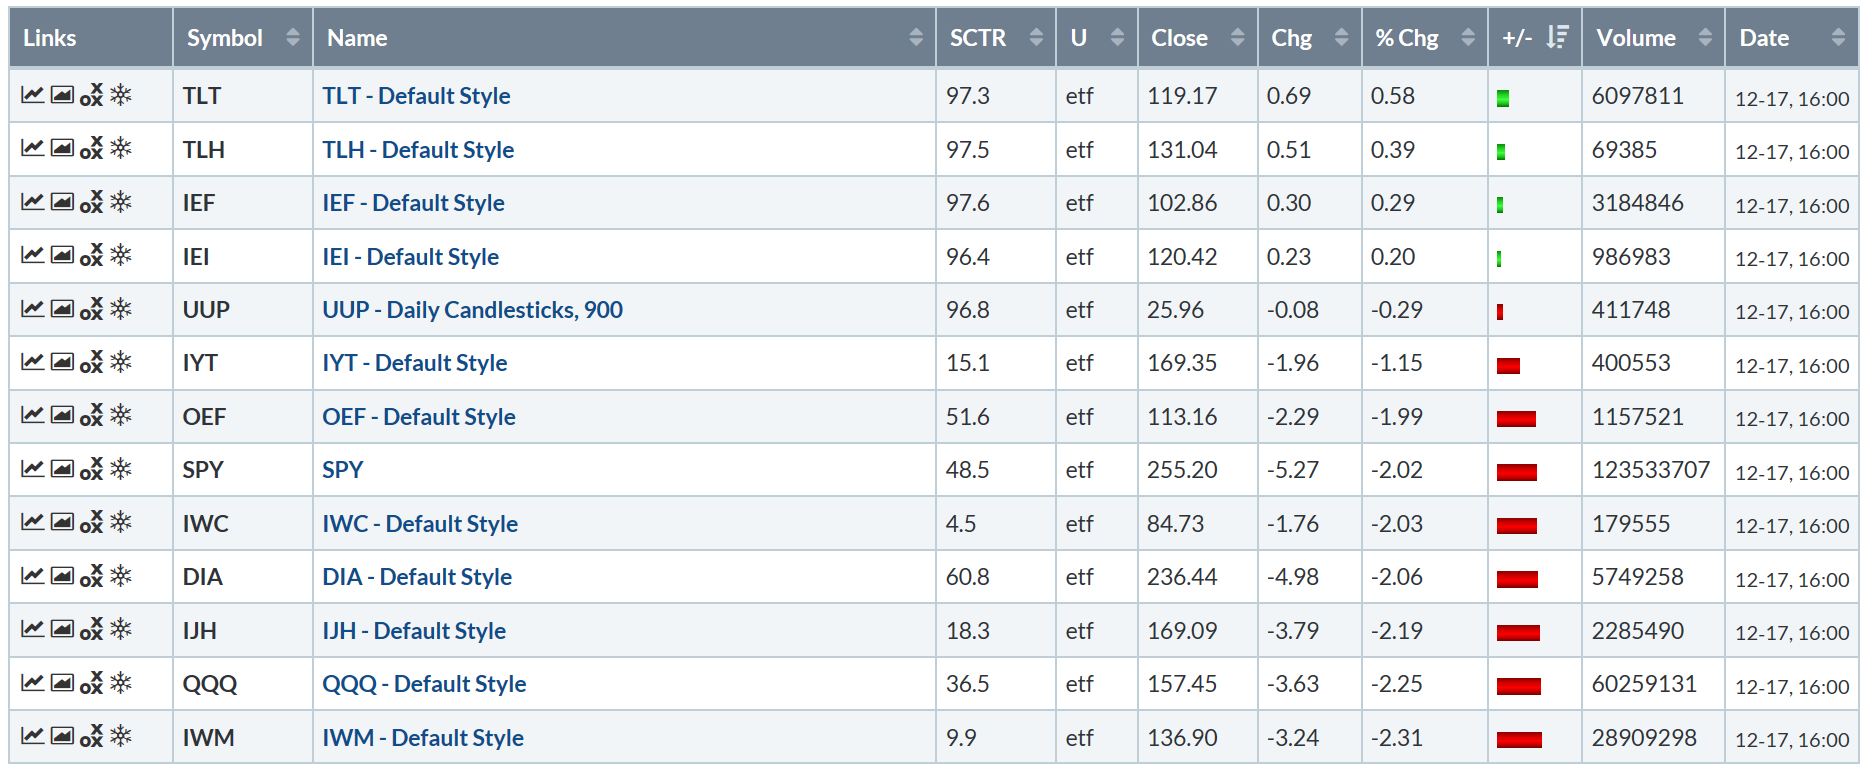
Let's check in on today's performance table:
Daily Performance Table

There's a lot of red in that table. The IWM (NYSE:IWM) fell the most; it was off 2.3%. The QQQ (NASDAQ:QQQ) wasn't far behind; neither were the mid-caps or the Dow. The long-end of the Treasury curve continued to rally, which will send yields lower and further compress the curve.

The industry table wasn't any better:

Daily Industry Table

Everybody was down today -- even the defensive sectors: utilities were the second-worst performer; staples were the fourth-worst. Healthcare -- which has the Johnson & Johnson (NYSE:JNJ) handicap -- actually performed modestly well, only dropping slightly more than 2%.

Before looking at the charts, let's remember where we left off last week. A lot of indexes are at or near 52-week lows. All the charts have a number of bearish indicators such as declining EMAs, shorter EMAs below longer EMAs, and negative momentum. This is also the Fed week; it would not be unheard of for the markets to tread water until the Fed announcement Wednesday afternoon.

However, most of the charts continue to contain a number of very bearish indicators
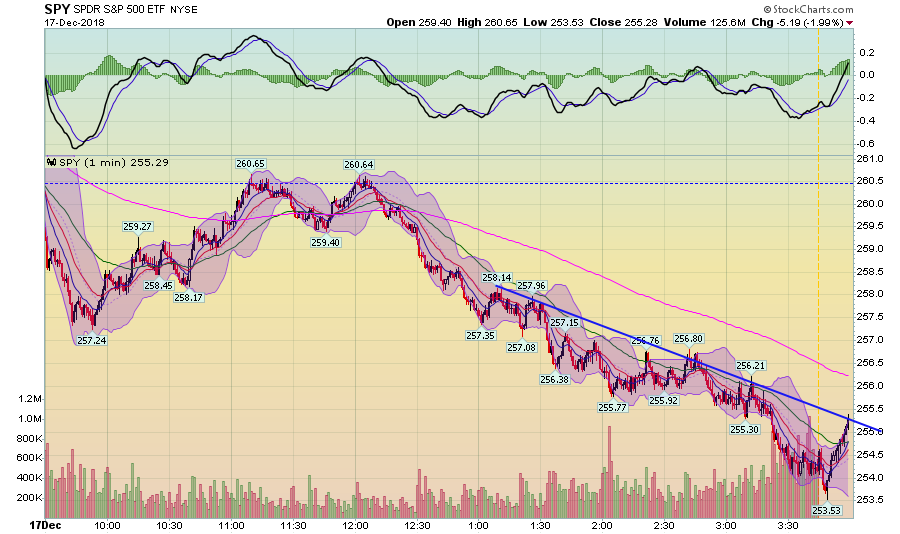
SPDR S&P 500 EFT
SPDR S&P 500 EFT

The markets opened lower. They tried to rally in the morning, twice attempting to move through last week's closing price. After forming a double top, prices moved lower for the remainder of the session, printing a series of lower lows and lower highs.

The bearishness continues on the 5-day chart:
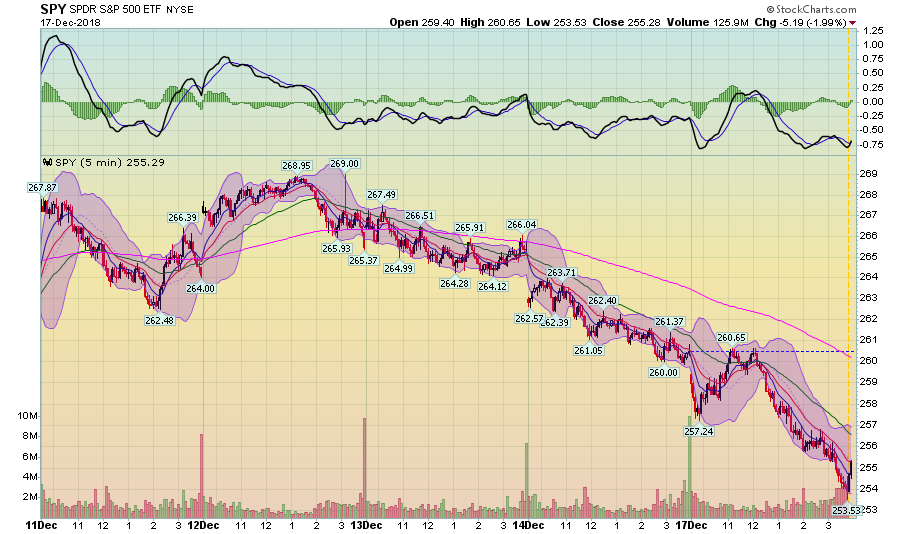
SPDR S&P 500 EFT, 5D

Prices are in a solid and continual three-day downtrend.

The 30-day chart is also bearish:
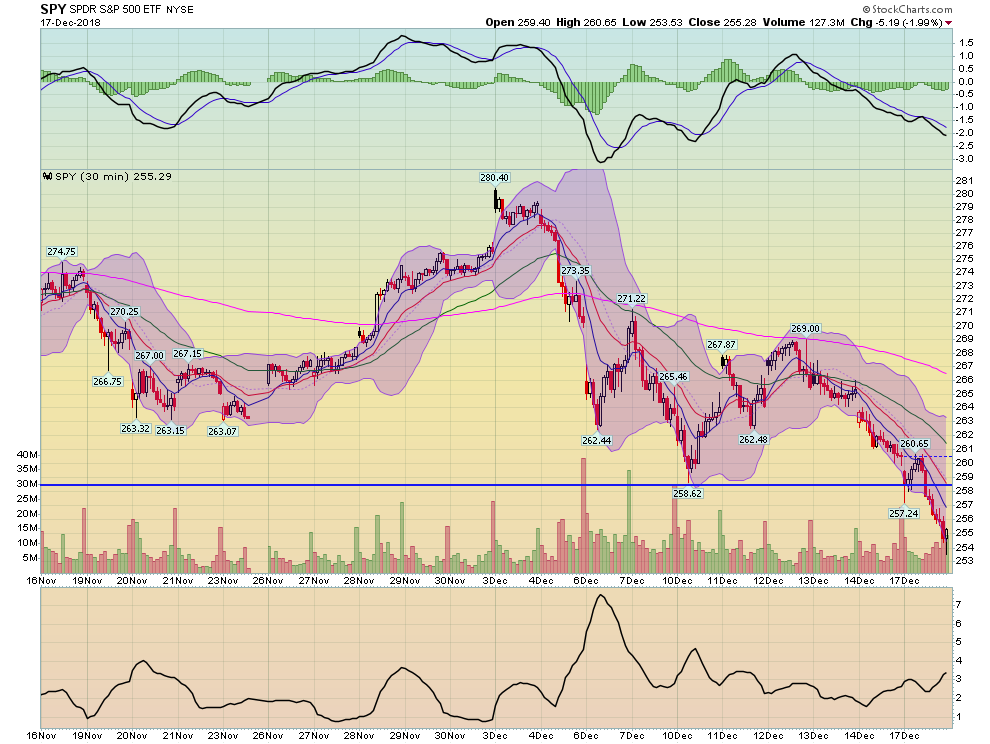
SPDR S&P 500 EFT, 30D

Prices have moved through the last technical support level and are now near a 30-day low.

And, yes, the daily chart is also bearish:
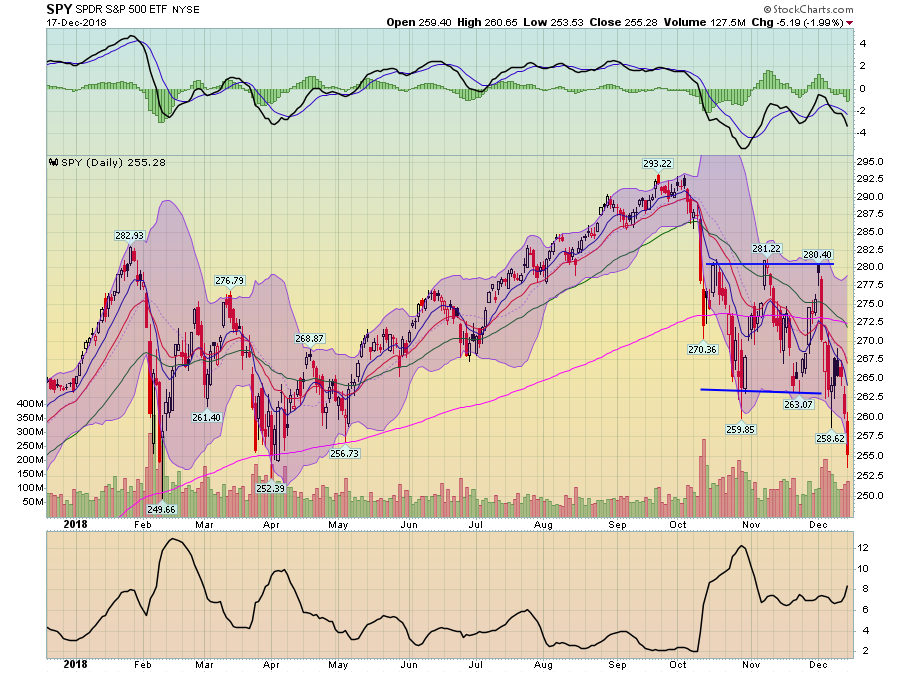
SPDR S&P 500 EFT, Daily

Prices have broken the lower support line of the sideways consolidation pattern.

The next logical technical support level is the 52-week low. And that's never a good place to be.

Disclosure: I/we have no positions in any stocks mentioned, and no plans to initiate any positions within the next 72 hours. I wrote this article myself, and it expresses my own opinions. I am not receiving compensation for it (other than from Seeking Alpha). I have no business relationship with any company whose stock is mentioned in this article.

Original post

Technically Speaking For December 17
 

Related Articles

Technically Speaking For December 17

Add a Comment

Comment Guidelines

We encourage you to use comments to engage with other users, share your perspective and ask questions of authors and each other. However, in order to maintain the high level of discourse we’ve all come to value and expect, please keep the following criteria in mind:  

  •            Enrich the conversation, don’t trash it.

  •           Stay focused and on track. Only post material that’s relevant to the topic being discussed. 

  •           Be respectful. Even negative opinions can be framed positively and diplomatically. Avoid profanity, slander or personal attacks directed at an author or another user. Racism, sexism and other forms of discrimination will not be tolerated.

  • Use standard writing style. Include punctuation and upper and lower cases. Comments that are written in all caps and contain excessive use of symbols will be removed.
  • NOTE: Spam and/or promotional messages and comments containing links will be removed. Phone numbers, email addresses, links to personal or business websites, Skype/Telegram/WhatsApp etc. addresses (including links to groups) will also be removed; self-promotional material or business-related solicitations or PR (ie, contact me for signals/advice etc.), and/or any other comment that contains personal contact specifcs or advertising will be removed as well. In addition, any of the above-mentioned violations may result in suspension of your account.
  • Doxxing. We do not allow any sharing of private or personal contact or other information about any individual or organization. This will result in immediate suspension of the commentor and his or her account.
  • Don’t monopolize the conversation. We appreciate passion and conviction, but we also strongly believe in giving everyone a chance to air their point of view. Therefore, in addition to civil interaction, we expect commenters to offer their opinions succinctly and thoughtfully, but not so repeatedly that others are annoyed or offended. If we receive complaints about individuals who take over a thread or forum, we reserve the right to ban them from the site, without recourse.
  • Only English comments will be allowed.
  • Any comment you publish, together with your investing.com profile, will be public on investing.com and may be indexed and available through third party search engines, such as Google.

Perpetrators of spam or abuse will be deleted from the site and prohibited from future registration at Investing.com’s discretion.

Write your thoughts here
 
Are you sure you want to delete this chart?
 
Post
Post also to:
 
Replace the attached chart with a new chart ?
1000
Your ability to comment is currently suspended due to negative user reports. Your status will be reviewed by our moderators.
Please wait a minute before you try to comment again.
Thanks for your comment. Please note that all comments are pending until approved by our moderators. It may therefore take some time before it appears on our website.
 
Are you sure you want to delete this chart?
 
Post
 
Replace the attached chart with a new chart ?
1000
Your ability to comment is currently suspended due to negative user reports. Your status will be reviewed by our moderators.
Please wait a minute before you try to comment again.
Add Chart to Comment
Confirm Block

Are you sure you want to block %USER_NAME%?

By doing so, you and %USER_NAME% will not be able to see any of each other's Investing.com's posts.

%USER_NAME% was successfully added to your Block List

Since you’ve just unblocked this person, you must wait 48 hours before renewing the block.

Report this comment

I feel that this comment is:

Comment flagged

Thank You!

Your report has been sent to our moderators for review
Continue with Google
or
Sign up with Email