
Technically Speaking For April 15
Summary
- International equity markets are signaling growth in the next 6-12 months.
- Zacks is projecting weaker earnings growth.
- Once again, the small-caps underperformed the larger-caps with the Treasury market moving higher.
Seeking Alpha is chock full of great analysis, some of which I try to highlight in my weekly summary. However, one of the drawbacks to publishing on Friday afternoon is that I can't cite people who publish over the weekend. Thankfully, this week's column from Jeff Miller contains a key insight about the market and earnings:
What this says to me is that we're seeing significant upside momentum in stocks. Historically, such momentum has led the market higher, though not necessarily at the same rate previously seen. The main takeaway is that we can't conclude that we're heading lower simply because we're "overbought". Whether we think the valuations are justified or not, whether we like macroeconomic forecasts or not, equities have found meaningful demand. Perhaps that's not so surprising in a world of low interest rates and tepid growth: U.S. stocks may offer some of the few havens for yield and growth.
I'm more bearish than Jeff regarding the markets. But his arguments are always centered on a very clean and fact-based reading of the data that deserves careful considering. If anything, it offers a very well-reasoned counter-argument to my bearishness.
Equity markets are leading indicators. Bearing that in mind, consider the following ETFs that track a broad swath of global indexes:

From left to right: all Asia less Japan, Emerging Markets, Europe, and Latin America. Three of these ETFs have rebounded from end-of-2018 lows while the fourth (Latin America) is moving sideways. The rallies indicate that traders see increased growth in three geographical areas.
As we enter earnings season, let's see what the folks at Zack's are projecting (emphasis added):
Earnings growth in 2019 Q1 is expected to turn negative, the first earnings decline since 2016 Q2. Driving the Q1 earnings decline are margin pressures across all major sectors even as revenues continue to grow.
Tough comparisons to last year when margins got a one-time boost from the tax legislation coupled with the rise in payroll, materials and transportation expenses are weighing on margins.
Total S&P 500 earnings are expected to decline -4.0% from the same period last year on +4.6% higher revenues and 100 basis points of compression in net margins. Earnings growth is expected to be negative for 10 of the 16 Zacks sectors, with Technology and Energy as the biggest drags.
This really isn't much of a surprise. We knew that last year's tax cuts would not only goose Q1 2018 earnings but also make Y/Y Q1 2019 comparisons difficult. Rising oil and payroll costs have been evident in the data for the last 4-6 months.
My basic market thesis: the markets are "toppy;" the rally in the Treasury market and large-cap equity indexes and underperformance of the smaller-caps indicates traders are projecting weaker growth. For my thesis to change I need a Treasury market selloff and/or a stronger small-cap performance.
That didn't happen today:

The Treasury market led the markets higher today, with the long-end of the government bond market leading the way. The larger-cap equity indexes fluctuated around the unchanged level while the smaller-cap indexes were off.
The charts, however, once again show a divergent performance.

After selling off in the morning, the QQQ had a strong rally that lasted most of the remaining trading session. Prices broke the uptrend in the last half hour of trading.
SPY trading was a bit messier. Prices sold off in the morning and consolidated in a triangle pattern until right after lunch. They moved up a bit, using the 289-290 level for technical support. 
In comparison is the IWM: after selling off, it moved modestly higher. But it really didn't engage in a meaningful rally.
Then we have the two-week charts, which show a sharp divergence.

The QQQ is in an upward sloping channel.

Again, the SPY's trading is messier, with several consolidation areas. But the overall pattern is higher.
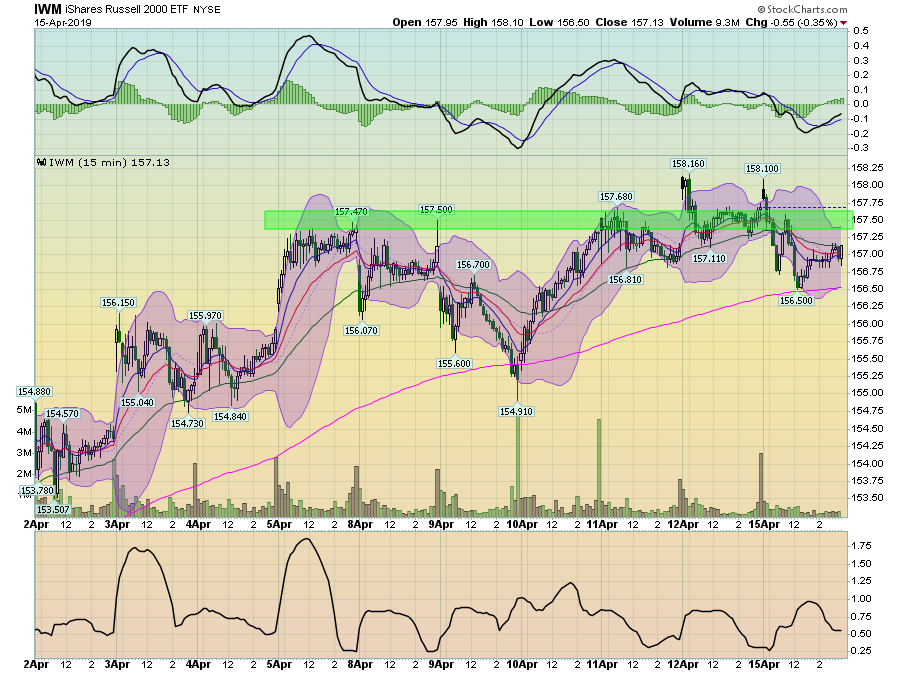
The IWM, however, hasn't been able to make meaningful gains above the mid-157s. After spiking to the lower 158 area, prices sold off, unable to maintain upward momentum.
And the IWC has twice tried to move about the mid-98 level, only to fall back.
The signal from the markets continues to be very clear: weak growth ahead.
Disclosure: I/we have no positions in any stocks mentioned, and no plans to initiate any positions within the next 72 hours. I wrote this article myself, and it expresses my own opinions. I am not receiving compensation for it (other than from Seeking Alpha). I have no business relationship with any company whose stock is mentioned in this article.