The economic calendar is normal and includes some important reports. Despite this, the data will be overshadowed by Q1 earnings reports. With opinion sharply divided on future economic prospects, many will want to know how companies are doing and what their leaders think. They will be asking:
What will Q1 earnings tell us about the strength and prospects for the economy?
Last Week Recap
In last week’s installment of WTWA, took note of the persistent discussion about the end of the economic cycle. Despite some of the typical crowding out from political stories, that topic got continued attention. On Friday, the story took a new turn as a touch of positive economic news from China was enough to tilt opinion. I agree with Eric Basmajian that we need to look beyond the PMI reports for real evidence. He cites export data from China’s trading partners as one useful approach. This is a good start but needs interpretation in the context of changing Chinese economic policy toward a consumer-driven economy. Contrast with the take from Pension Partners, reliant more on the recent PMI uptick. More solid indicators are needed.
The Story in One Chart
I always start my personal review of the week by looking at a great chart. This week I am featuring Investing.com’s interactive chart. Check it out at the site to use the interactive features, including call outs for key news events.

The gain on the week, built on Friday’s trading, was 0.5%. The trading range was a modest 1.0%. As always, our indicator snapshot in the quant section below summarizes volatility and the VIX index in various time frames.
Noteworthy
Plastic bottles have surpassed plastic bags as the biggest threat to oceans and rivers, reports Melissa Locker in FastCompany. The Chinese shift away from accepting foreign waste has removed a cheap and easy alternative. Now it is time (and most of us would say well past time) to find recycling solutions.
I briefly looked for some pure-play public companies making progress on plastic recycling, but the project was too big for my WTWA writing day. Perhaps readers will have ideas and include them in the comments.
The News
Each week I break down events into good and bad. For our purposes, “good” has two components. The news must be market-friendly and better than expectations. I avoid using my personal preferences in evaluating news – and you should, too!
When relevant, I include expectations (E) and the prior reading (P).
New Deal Democrat’s high-frequency indicators are an important part of our regular research. Long-term indicators have improved to positive, but the nowcast and short-term indicators are both negative. His conclusion?
I think too much emphasis is being put on a few short-term indicators by most observers. While interest rates have improved, we still have to get through last year’s weakness in the long leading indicators before the improvement filters through.
The Good
- The NFIB Index rose to 101.8 up slightly from the prior month and beating expectations of 101.3. The attitudes of independent business people is especially important in the current environment. Jill Mislinski helps us see the strength, despite the decline from the peak.
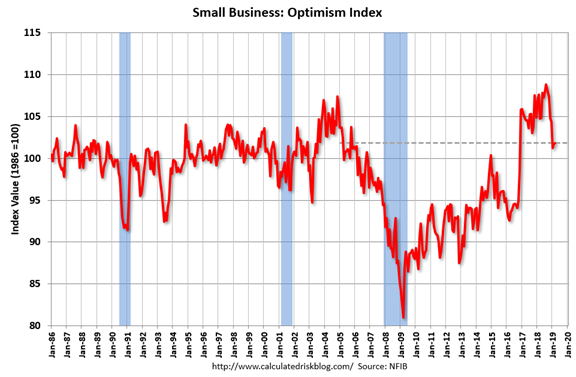
The Daily Shot illustrates the biggest problem facing small businesses.

- Core CPI increased only 0.1%, matching the February reading and lower than expectations of 0.2%. The market seemed untroubled by the headline number which increased 0.4%, more than expectations of 0.3%. Some observers think that inflation at 2% or above is “good” since it meets a Fed target. I prefer moderate, predictable inflation while using other measures to evaluate economic growth. Bespoke highlights the 2019 surge in gasoline prices with an interesting chart.

- Initial jobless claims were only 196K, better than even the prior 204K and much better than expectations of 215K. Continuing jobless claims also look good, as reported by the Daily Shot.

- Chinese exports for March rebounded strongly (MarketWatch).
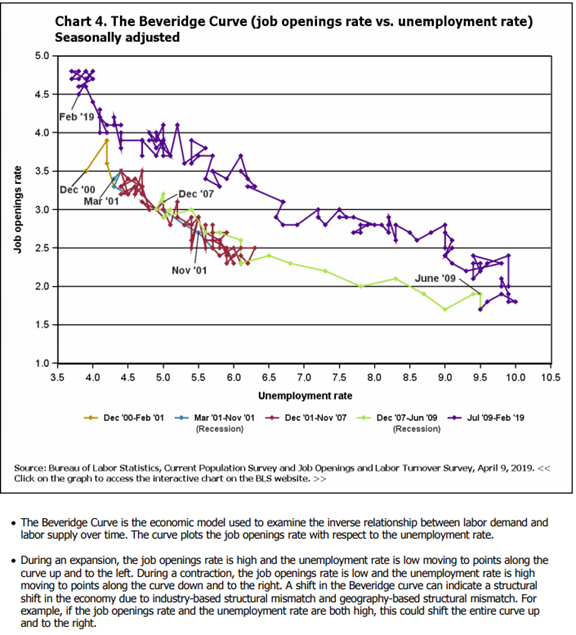
- The JOLTS report showed continuing labor market strength and signs of a changed structure. As usual, most pundits just looked at job openings. This is a small part of the picture, and not the most important. The Washington Center for Equitable Growth provides the best summary of this report and this week needed only four charts and captions. Quit rates (showing confidence) remained high, hires constant despite fewer openings, and still fewer than one unemployed worker per opening. Finally, they show the Beveridge Curve, completing the overall story of a tightening market, but still showing some slack versus past occasions. Below is the official BLS version of that chart, including their interpretation.
The Bad
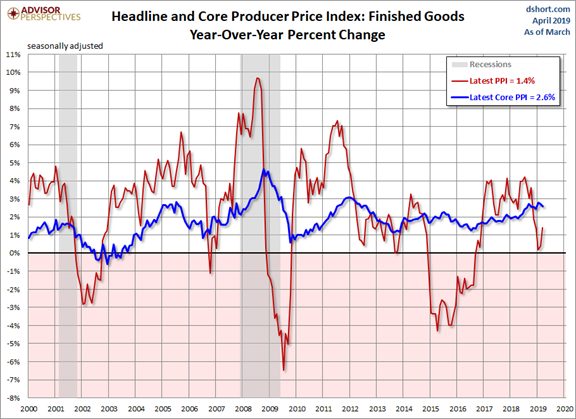
- Core PPI increased 0.3% in March, worse than expectations of 0.2% and the February increase of 0.1%. For my interpretation, see CPI above. Jill Mislinski has analysis and this chart:
- Factory orders for February declined -0.5%, slightly better than the expected -0.6% but worse than January’s unchanged reading. While this beat expectations, so it technically qualifies as “good” on my scoring system, I’ll wait for a stronger result.
- FOMC minutes seemed less dovish than the actual announcement and press conference, but the market was untroubled. Steven Hansen (GEI) emphasizes the inability of Fed members to reach a meaningful consensus on key factors. He also criticizes the market’s narrow focus on rates.
- Michigan Consumer Sentiment on the April preliminary reading was only 96.9, lower than March’s 98.4 and expectations of 98.0.
The Ugly
Financing for the Hudson Yards project. Kriston Capps (CITYLAB) describes how a visa program designed to attract foreign investors to poverty-stricken areas wound up funding a massive luxury project. And of course, competing projects lost out. I used to teach a segment on unforeseen policy consequences as part of my class on public policy formation. This would be an excellent example. Here is a clue about how a wealthy area was deemed to be part of a poor district.

The Week Ahead
We would all like to know the direction of the market in advance. Good luck with that! Second, best is planning what to look for and how to react.
The Calendar
We have a normal economic calendar with several key reports. March retail sales is important as are the housing reports, especially starts and permits. Industrial production is a key element of tracking economic progress. The leading indicators remain an important measure for some.
Looking to April data, the Philly Fed always attracts interest for that reason. The Fed Beige Book will provide anecdotal evidence about conditions around the country, but it rarely moves markets.
The biggest stories will be the Q1 earnings reports.
Briefing.com has a good U.S. economic calendar for the week. Here are the main U.S. releases.

Next Week’s Theme
The calendar is normal with several key reports, but I expect earnings news to be the focus. I expect pundits to be asking:
What will Q1 earnings reports reveal about the economy?
The Current Viewpoints
Earnings season has so many different angles. It is fertile territory for those on a mission: Finding evidence to support their existing positions. The punditry is free to focus on big beats or misses, revenue gains or shortfalls, or changes in guidance. Honest statements about concerns – trade, foreign exchange – will be blown up in media reports. The reaction of stocks to the objective news varies widely from season to season.
Those on my “reliably bearish” Twitter list (follow me at @dashofinsight) write that earnings expectations are too high because of analyst optimism. They also write that the high “beat rate” is because the bar is set too low. Go figure.
Our leading earnings gurus, whom we will follow carefully in the next few weeks, provide some ideas about what to watch.
Friday results included some big positive surprises, providing some comfort for markets (Brian Gilmartin). Can this continue?
John Butters (FactSet) notes foreign exchange as a negative factor in the most earnings calls to date. Will this continue?
The Corbin Quarterly Earnings Primer is packed with useful insights. Most important is that analysts (combining both buy- and sell-side) expect key metrics to remain flat or decelerate. They also agree on the importance of this earnings season. I love the word cloud as a simple way to see conclusions and gain color on comments. This is great information on analyst expectations as we enter the earnings season.

Investors remain cautious as earnings season starts. (David Templeton, HORAN).

Dr. Brett Steenbarger emphasizes what he sees in market data. He has been a bit of a market skeptic, but (as always) remains open-minded when seeing fresh data. Read the entire post and appreciate the rationale, but here is a key part of his conclusion:
What this says to me is that we’re seeing significant upside momentum in stocks. Historically, such momentum has led the market higher, though not necessarily at the same rate previously seen. The main takeaway is that we can’t conclude that we’re heading lower simply because we’re “overbought”. Whether we think the valuations are justified or not, whether we like macroeconomic forecasts or not, equities have found meaningful demand. Perhaps that’s not so surprising in a world of low interest rates and tepid growth: U.S. stocks may offer some of the few havens for yield and growth.
I certainly don’t know what the earnings reports will be, but I have ideas on how to prepare. I’ll offer my own conclusions in today’s Final Thought.
Quant Corner and Risk Analysis
I have a rule for my investment clients. Think first about your risk. Only then should you consider possible rewards. I monitor many quantitative reports and highlight the best methods in this weekly update, featuring the Indicator Snapshot.

Short-term and long-term technical conditions continue at the most favorable level. Our fundamental indicators have remained bullish throughout the December decline and rebound. The C-Score reflects the increase in headline inflation, despite slight steeping in the yield curve. I am watching this closely, including analyzing signs of possible confirmation.
The Featured Sources:
Bob Dieli: Business cycle analysis via the “C Score.
Brian Gilmartin: All things earnings, for the overall market as well as many individual companies.
RecessionAlert: Strong quantitative indicators for both economic and market analysis.
Georg Vrba: Business cycle indicator and market timing tools. The most recent update of Georg’s business cycle index does not signal recession.
Doug Short and Jill Mislinski: Regular updating of an array of indicators. Great charts and analysis.
Guest Commentary
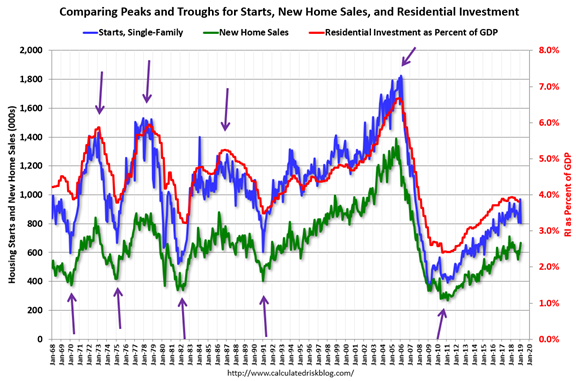
Calculated Risk’s approach to recession forecasting, not surprisingly, centers on housing data. It is always useful to complement our own favorite analyses with alternative approaches. Bill is still not on “recession watch” and is also constructive on the housing rebound.
Business cycle expert James Picerno’s analysis leads him to conclude:
Using last week’s macro profile as a guide, the odds still favor growth for the US outlook. Although the expansion has slowed, recession risk remains low, based on data published to date. Projecting the macro trend into the immediate future also points to a low probability that an NBER-defined downturn is near.
He cautions that stocks may not follow the economic cycle, citing 2001 as an example.
Insight for Traders
Check out our weekly “Stock Exchange.” We combine links to important posts about trading, themes of current interest, and ideas from our trading models. Last week we asked fellow traders whether the times were right to “lever up” on momentum trading. We cited some great sources and discussed some recent picks from our trading models. Felix rated the top twenty stocks in the DJIA and Oscar did the same for the most liquid ETFs. Pulling this altogether was our regular editor, Blue Harbinger.
Insight for Investors
Investors should embrace volatility. They should join my delight in a well-documented list of worries. As the worries (shutdown, Fed policy, trade) are addressed or even resolved, the investor who looks beyond the obvious can collect handsomely.
Best of the Week
If I had to recommend a single, must-read article for this week, it would be Steve Wendel and Samantha Lamas’s Morningstar article, Uncovering Your Real Goals. Their article takes head-on the most important part of your investment process: Determining your goals. This is easy to state, but extremely difficult in practice. Their simple idea includes listing your top three goals, and then looking at a “master list” of popularly cited goals. In their study, 73% of the subjects changed at least one goal after seeing the master list.
They include citations to the full study, of course. Read the full post for the master list and their reasons for why it works. (I’m not going to spoil the exercise by citing the list here. Readers who want to play along should start by writing down their top three investing goals and then reading the article).
Stock Ideas
Chuck Carnevale has two new installments in his sector-by-sector search for value — the process industries and producer manufacturing. As always, you get great lessons on investment research as well as excellent ideas.
Gilead Sciences (NASDAQ:GILD) is known for too much success – curing patients and thereby losing revenue. The story is deeper, of course, but that attitude has kept the stock price depressed. Stone Fox Capital suggests that a turn in earnings might mark a bottom in the stock price.
Kirk Spano is playing long ball with Amazon (NASDAQ:AMZN) v Microsoft (NASDAQ:MSFT) & Tesla (NASDAQ:TSLA) v The World. He explains, for example, why he favors Microsoft in the battle for the big Pentagon cloud service contract.
Dividend ideas chosen for safety rather than a reach for yield. (Barron’s)
Beth Kindig takes a careful look at TradeDesk (TTD). Can the company sustain the huge stock price gains? This is a balanced analysis highlighting some of the key risks as well as the company’s successful competition with Google (NASDAQ:GOOGL) and Facebook (NASDAQ:FB).
“Davidson” (via Todd Sullivan) rarely mentions individual stocks. This week he suggests Fastenal (NASDAQ:FAST), a company consistent with his (and my) macro view. The current stock price reflects the current climate of investor recession fears, tracking the monthly low trend line. He expects, as do I, eventual recognition of the continuing economic expansion and resulting price appreciation.
Personal Finance
Seeking Alpha Senior Editor Gil Weinreich’s Asset Allocation Daily is consistently both interesting and informative. Each week he highlights stories of interest for both advisors and investors. He takes on the most challenging problems, as he did in this week’s discussion of retirement reforms. He accurately concludes that real leadership is needed, more than technical fixes:
However, more challenging situations – for example a society-wide dearth of retirement savings, a public pension system heading toward insolvency and a heavily indebted government lacking obvious means of repairing the problem – cannot be addressed with mere technical fixes. They require what Heifetz and Linksy referred to as adaptive leadership. It is not enough to unleash the technical experts, to close loopholes, to “test closed DB plans.” Rather, when we are on a course that is generally acknowledged to be unsustainable, it is we who are the problem. And the key leadership challenge at such a time is to help people understand why we must change and how we can do so.
Abnormal Returns always provides interesting ideas on a wide variety of topics. Each Wednesday’s edition includes a post focused on personal finance. This week I especially enjoyed Nate Geraci’s post, The Financial Literacy Riddle. It is a nice blend of results from financial literacy tests, a discussion of the behavioral challenges in improvement, and a few ideas for change.
Watch out for…
Restaurant stocks – JP Morgan via Barron’s.
Endangering your retirement with the latest “fad” stocks and sectors. (NYT)
Buying an annuity from Keith Richards. Tony Isola describes the group of annuity issuers sponsoring the Stones tour and recommends a playlist for people for people thinking about purchasing some of them, e.g. Play With Fire (1965).
Final Thought
I expect a normal beat rate of the lowered estimates. Any executive with a lot of foreign business would be crazy not to mention that in discussion, providing plenty of fodder for the naysayers.
The lowering of estimates has been much more aggressive than in the past, so a lot of caution is built in.
The key to earnings comparisons is where you start. If you want to compare this quarter to a year ago, it is what we call a “tough comparison.” This traditional method of looking at the prior year’s quarter leaves much to be desired. Suppose we knew for certain that earnings did not grow. Would we expect stocks to remain flat or decline?
In 2018 we had fantastic earnings growth but no stock reaction. Why was that.
You can always reach a desired conclusion by changing your starting point.
A Better Method
The statements about earnings growth are accurate but unhelpful – perhaps even misleading. As happens so often the punditry is looking at the wrong measure. The market evaluates stocks via expected earnings, not with a rear-view mirror.
Last year, earnings growth was seen as ephemeral and unsustainable. This viewpoint persists for many. This year the recession concerns have abated somewhat, leading to a more positive outlook.
My outlook for the year continues to look promising. I elaborated this week at the FATRADER site, including this summary chart as a guide to shopping. I also mentioned a few changes in trading positions.