
Turning Points For The Week Of April 8-12
Summary
- The long-leading indicators are positive and have improved.
- The leading indicators - especially the yield curve - continue to argue for a recessionary possibility in the next 6-12 months.
- My recession probability in the next year remains at 25%.
The purpose of the Turning Points Newsletter is to look at the long-leading, leading, and coincidental economic indicators to determine if the economic trajectory has changed from expansion to contraction - to see if the economy has reached a "Turning Point."
Long-Leading Indicators
As we are at the beginning of earnings season, it seems appropriate to start with corporate profits as reported by the BEA:
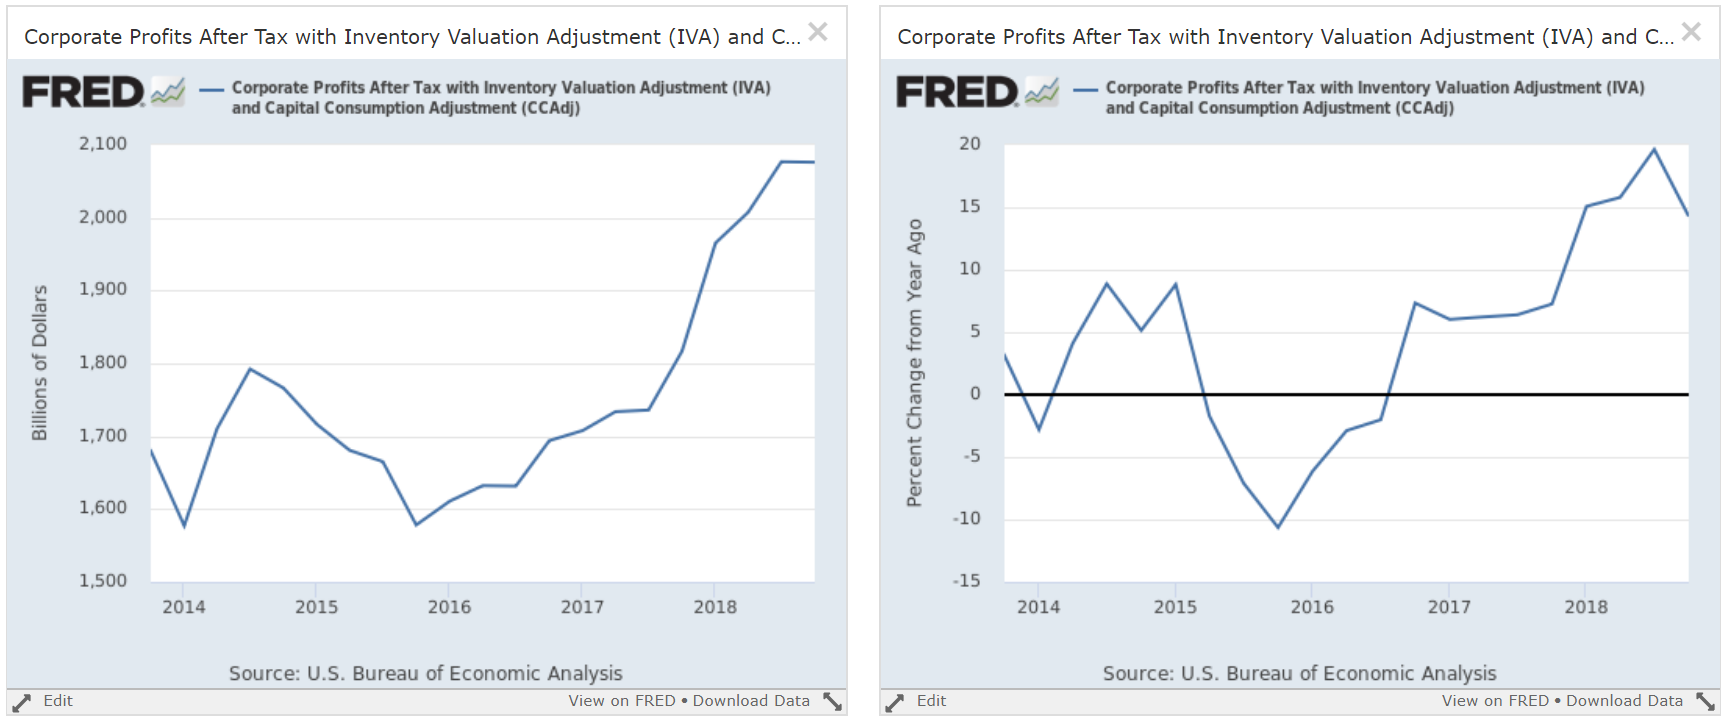
Profits have increased in total (left chart) and on a Y/Y basis (right chart) since the end of 2015. They were stable in the latest report, which led to a modest decrease in the Y/Y pace. But that's to be expected.
Corporate credit has eased somewhat:
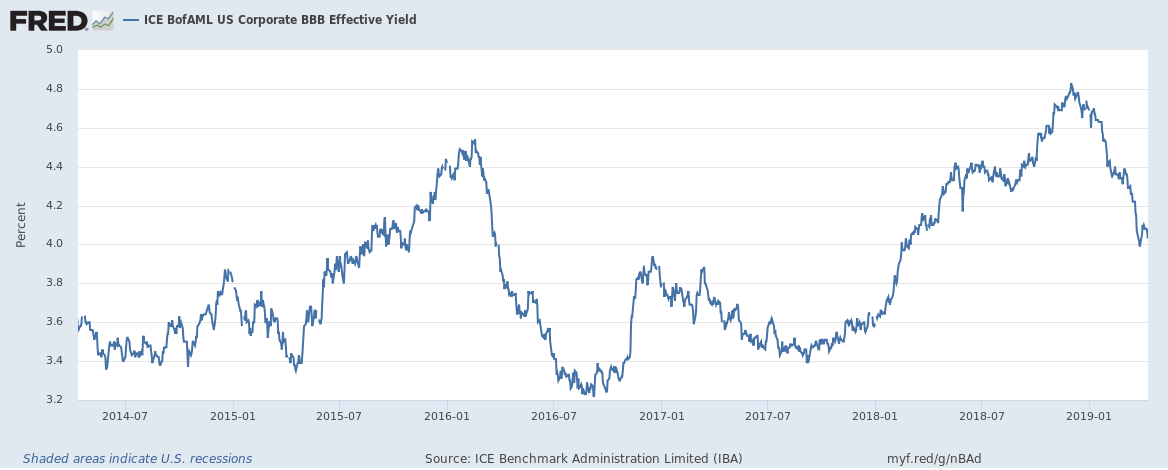
The BBB yield rose to 4.8% at the end of last year but has since declined .8% (80 basis points), moving yields to levels last seen at the beginning of 2018. This means the cost of credit for lower-rated corporations is now far cheaper.
Finally, there is a money supply:
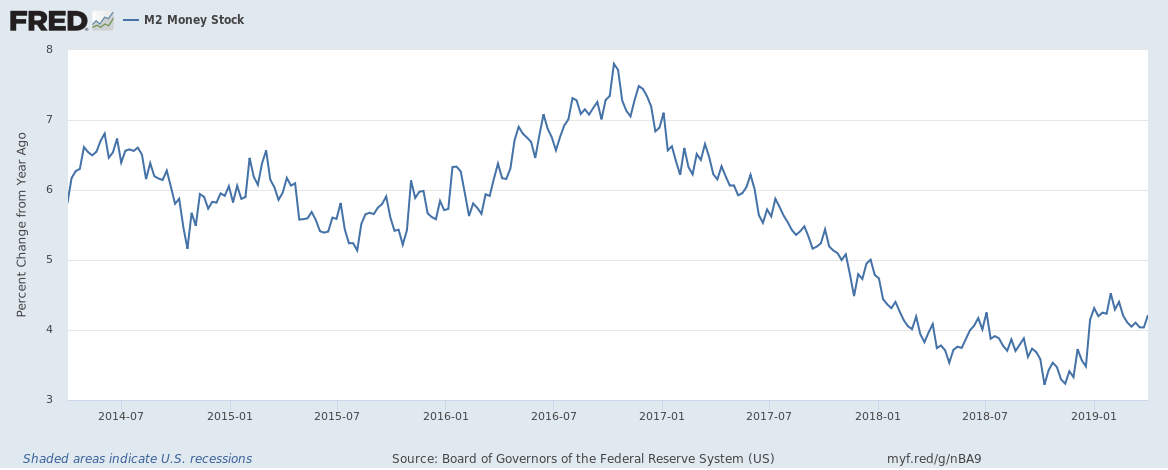
M2 has increased on a Y/Y basis since the end of last year but is still in the lower range of percentage increases.
Long-leading conclusion: All these indicators are positive. Corporations not only have ample profits to finance operations (which goes a long way to explaining the solid state of the labor market), but also the cost of credit is now cheaper and money supply is growing just a little bit faster.
Leading Indicators
Let's begin with the two labor market indicators - the four-week moving average of initial unemployment claims and the total number of insured people who remain unemployed: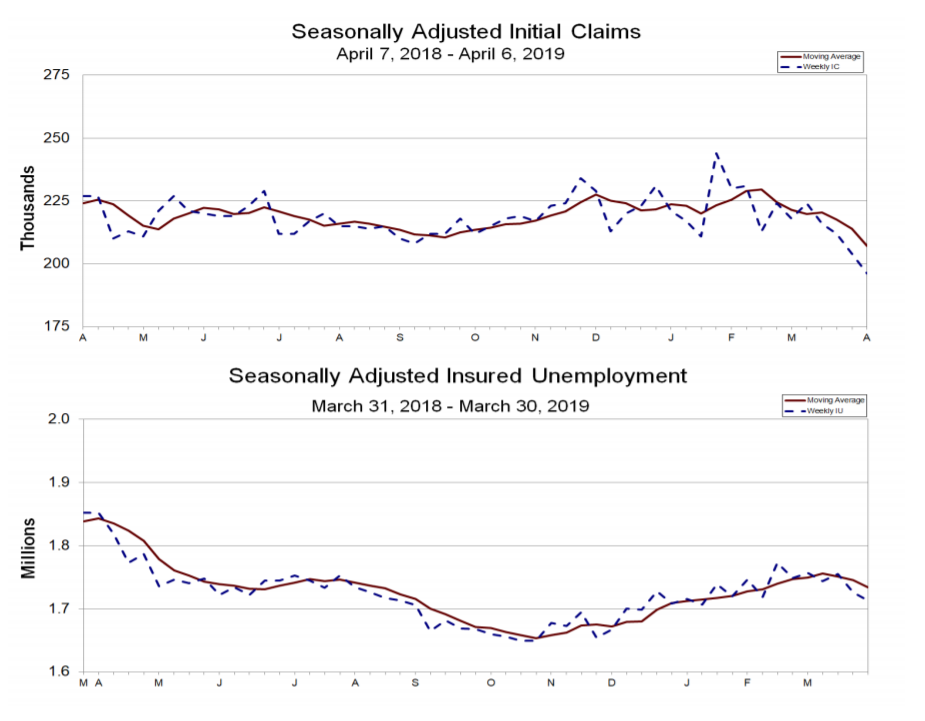
The four-week moving average (top chart) is - once again - at a cycle low. It hit 210,500 on September 22, 2018, but is now 207,000. The compressed five-year chart shows the drop in better detail: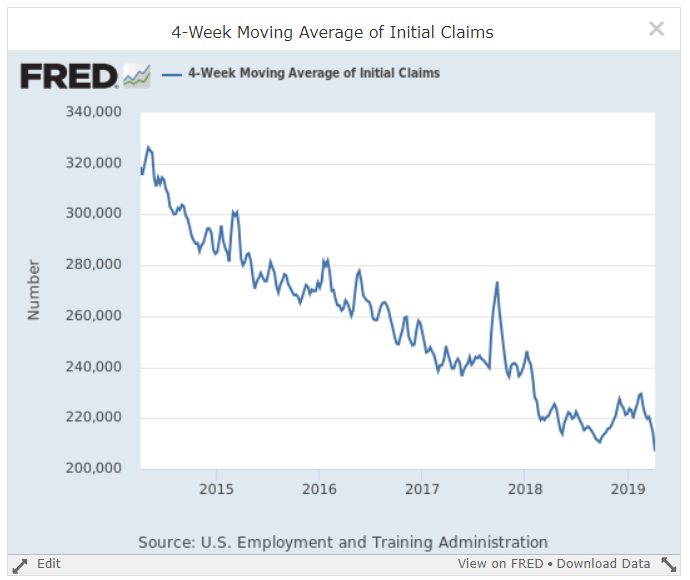
The total number of people who are unemployed and still receiving benefits (bottom charts above) is also decreasing modestly, indicating more unemployed people are finding work. These are very positive developments, indicating that recent labor market weakness was then likely temporary.
Both leading durable goods order numbers are softer:
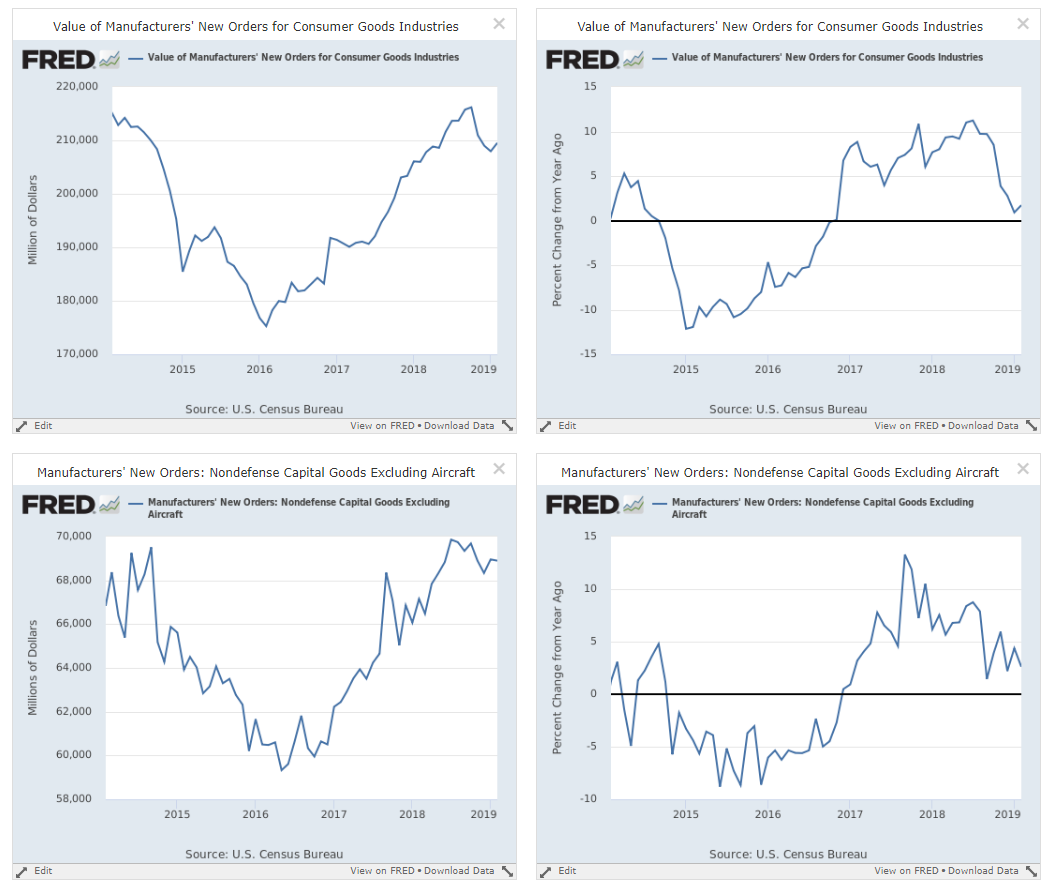
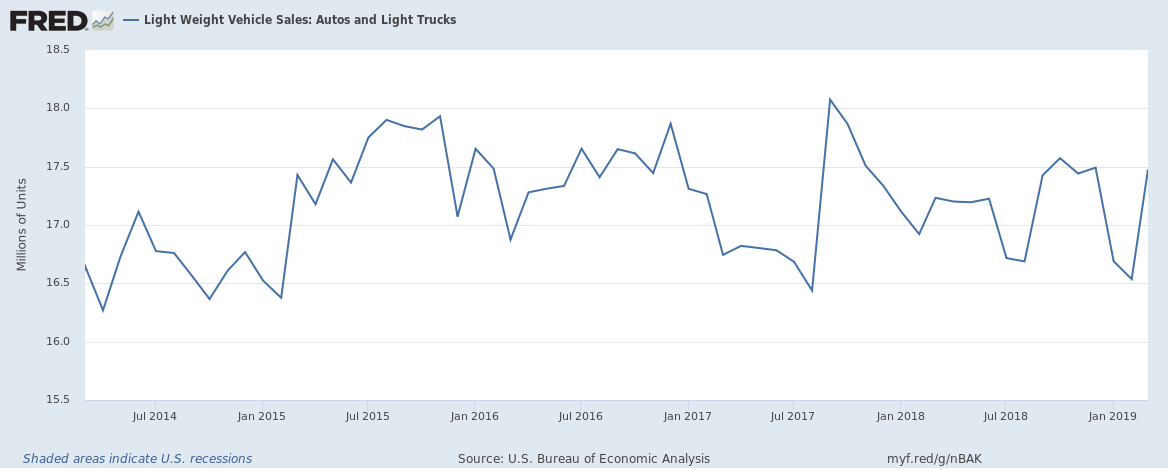
New orders for consumer durable goods (top two charts) are weaker on an absolute (left chart) and Y/Y (right) basis. The same can be said of capital goods orders for businesses (bottom two charts). The decline in consumer durable orders is largely a function of weaker auto sales, which have more or less plateaued for this cycle:
Weak business durable goods orders are a function of soft business investment, which was noted in the latest Fed Meeting Minutes:
Factors cited as consistent with the recent softness in investment growth included downward revisions in forecasts of corporate earnings; relatively low energy prices that provided less incentive for new drilling and exploration; flattening capital goods orders; reports from contacts of softer export sales and of weaker economic activity abroad; elevated levels of uncertainty about government policies, including trade policies; and the likely effect of recent financial market volatility on business sentiment.
The Fed argues the recent weakness is temporary. Obviously, time will tell. But it does mean we should pay extra attention to earnings calls this quarter looking for commentary on capital investment.
And building permits are also softer:
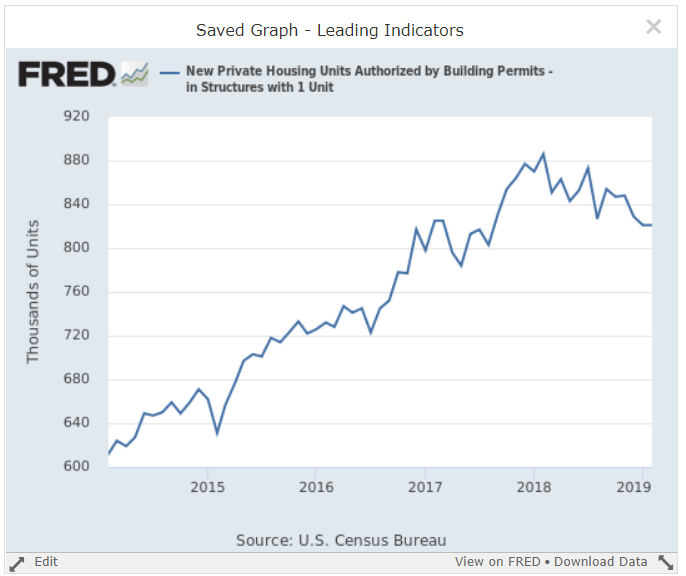
The decline above is consistent, but modest, and is most likely caused by increasing interest rates. The recent decline in 15- and 30-year mortgages should help to alleviate some of this weakness.
Finally, the yield curve is still in a pre-recession configuration:

The 10-year/3-month spread contracted a few weeks ago. It has since widened but is still very narrow.
 The belly of the curve - the 7-, 5-, and 3-year spreads to the 1-year CMT (constantly maturing treasury) - is underwater. The 5- and 3-year-1-year spreads have been negative since the very end of last year.
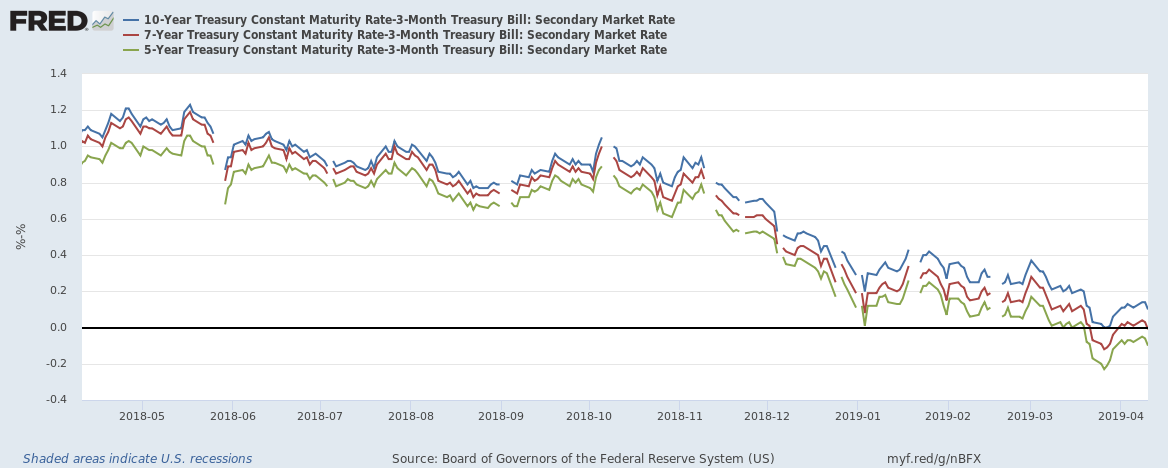
And the 10-, 7-, and 5-year/3-month spreads are still very narrow. The 5-year-3-month spread has been negative for a few weeks, while the other two spreads continue to tighten
Leading indicators conclusion: While the labor market numbers have improved, the softness in durable goods orders and narrowing of the yield curve will keep my recession probability in the next 6-12 months at 25%.
Disclosure: I/we have no positions in any stocks mentioned, and no plans to initiate any positions within the next 72 hours. I wrote this article myself, and it expresses my own opinions. I am not receiving compensation for it (other than from Seeking Alpha). I have no business relationship with any company whose stock is mentioned in this article.