While many thought that 2018 will be the greatest year for Bitcoin and other cryptocurrencies, the market experienced a very harsh year so far. At the time of writing, and according to the global market capitalization on Coinmarketcap, the cryptocurrency market tanked by more than 80 percent since its peak on January 7, 2018. While Bitcoin declined more than 55 percent since the first of August, Ethereum declined even more, falling by 78 percent during that time. However, there is one cryptocurrency which surged more than 515 percent since the first of August, and if we look at the low from the week prior to August, Nexo surged by an incredible 790 percent.
Let’s have a look at the current outlook of Ethereum and Nexo in the daily chart.
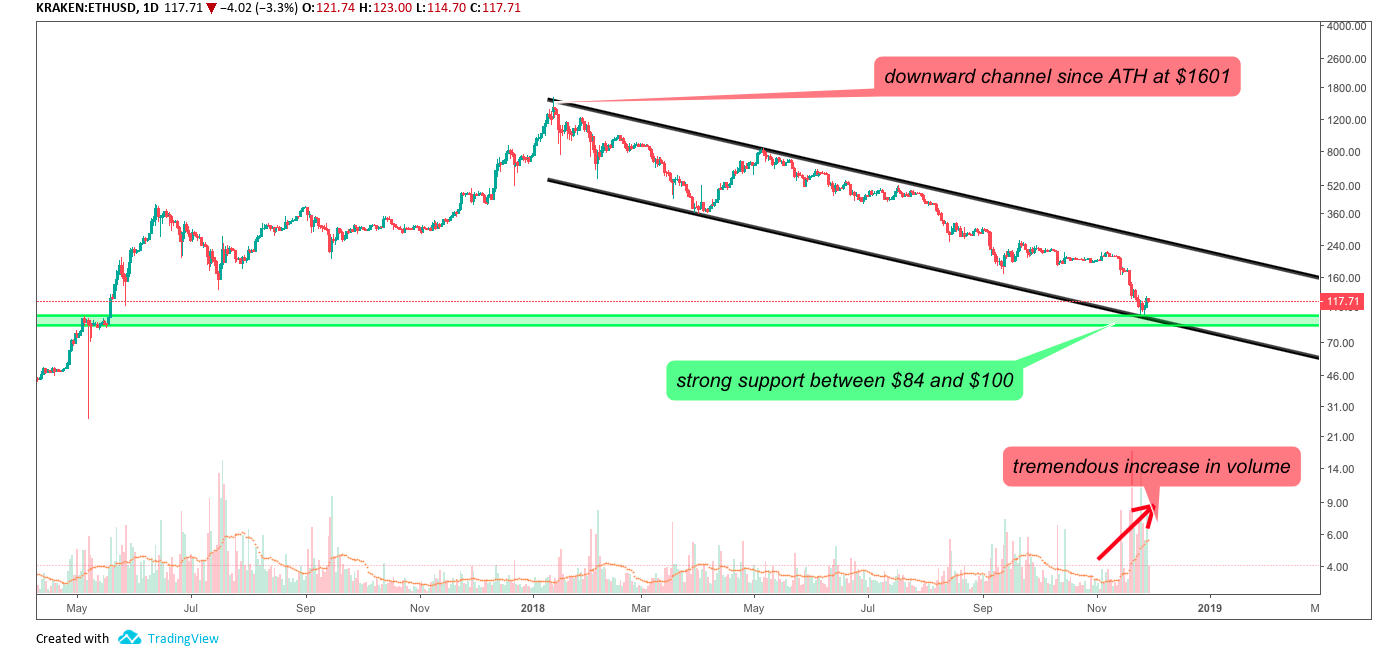
ETH/USD Kraken Daily
Since the peak on January 14, 2018, Ethereum declined by more than 92 percent. Ethereum formed a downward parallel channel for the whole year of 2018 and recently bounced from the very strong support between $84 and $100. However, the tremendous increase in volume during the most recent drop is a very bearish sign. Despite the fact that Ethereum will most likely follow its path towards the downside, the recent bounce from the support confirmed the significance of this support, therefore we can assume a short-term increase in price to its prior low at $170, which acts as a strong resistance and Ethereum will most likely face rejection.
Nexo had an incredible summer so far, mostly due to the recent innovations it presented. Nexo became the first crypto-lending platform to offer XRP as collateral. The Ripple community strongly welcomed this move, requesting for more than $2M crypto-backed loans in less than 24 hours. Nexo also offered the only protection on the market for stablecoins by guaranteeing a 1-to-1 conversion for any stablecoin that is registered by its Liquidity Providers – who in turn earn 6.5% rewards. Finally, integrations with several crypto websites - most notably Coinmarketcap - drew more acceptance for the platform.
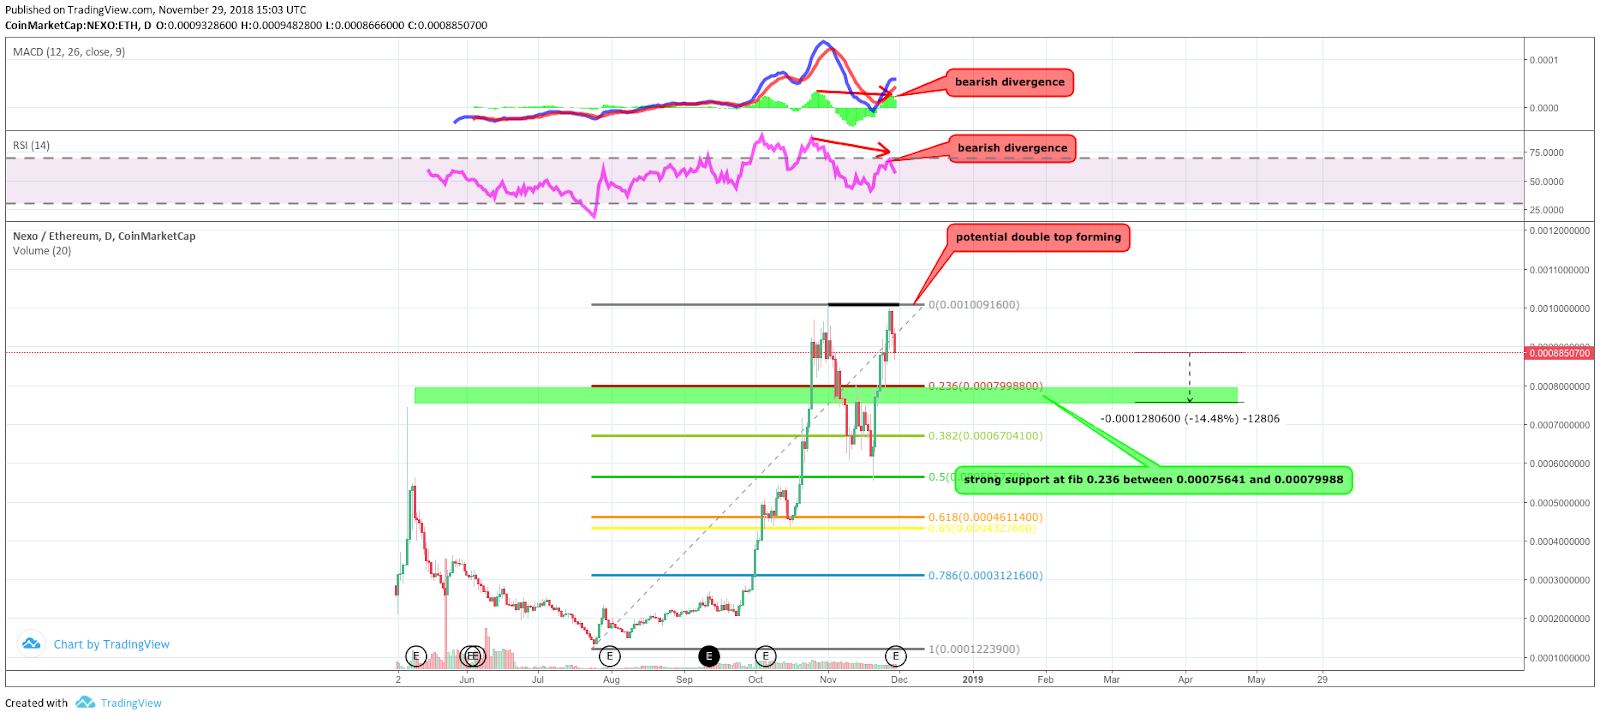
However, with it recently facing rejection at the previous high established on the first of November, there is a chance it will form a bearish double top pattern. The Relative Strength Index is losing steam and performing lower highs, so the bearish divergence is a strong sell signal. Additionally, the histogram highs in the Moving Average Convergence Divergence indicator are ticking lower while the price climbed higher, showing another bearish divergence. Having said that, Nexo finds its next support at the prior high which happens to be located at the 0.236 fib level. This makes a short-term decline of 10-14 percent very likely.
Looking at the previous trend, it would be worthwhile to mention that Nexo is paying out 30% of its profit as dividends to NEXO token holders on December 15, which could potentially drive the price up again.


