As we come to the end of the month of June, we not only come to the end of the second quarter of the year, but we also end the first half of the year. This is a great time to take an assessment of how things are going with our trading. As you look at your trading results, take some time to look at key statistics such as your win: loss ratio and your average win: average loss ratio. These ratios can give you important information about how you’re trading. If these two things are out of sync with each other you may not be as profitable as you could.
This last week we had quite a few economic reports come out but really did not see any significant surprises. This upcoming week we have the all-important nonfarm employment numbers which will be released on Friday. This is one day after the July 4th holiday where we will see the major U.S. stock markets closed for the day. This could add some volatility as we have this news announcement come out after market closure. In addition, we are likely to be hearing more about the upcoming earnings season as we move into the month of July. This can always cause added volatility in the markets.
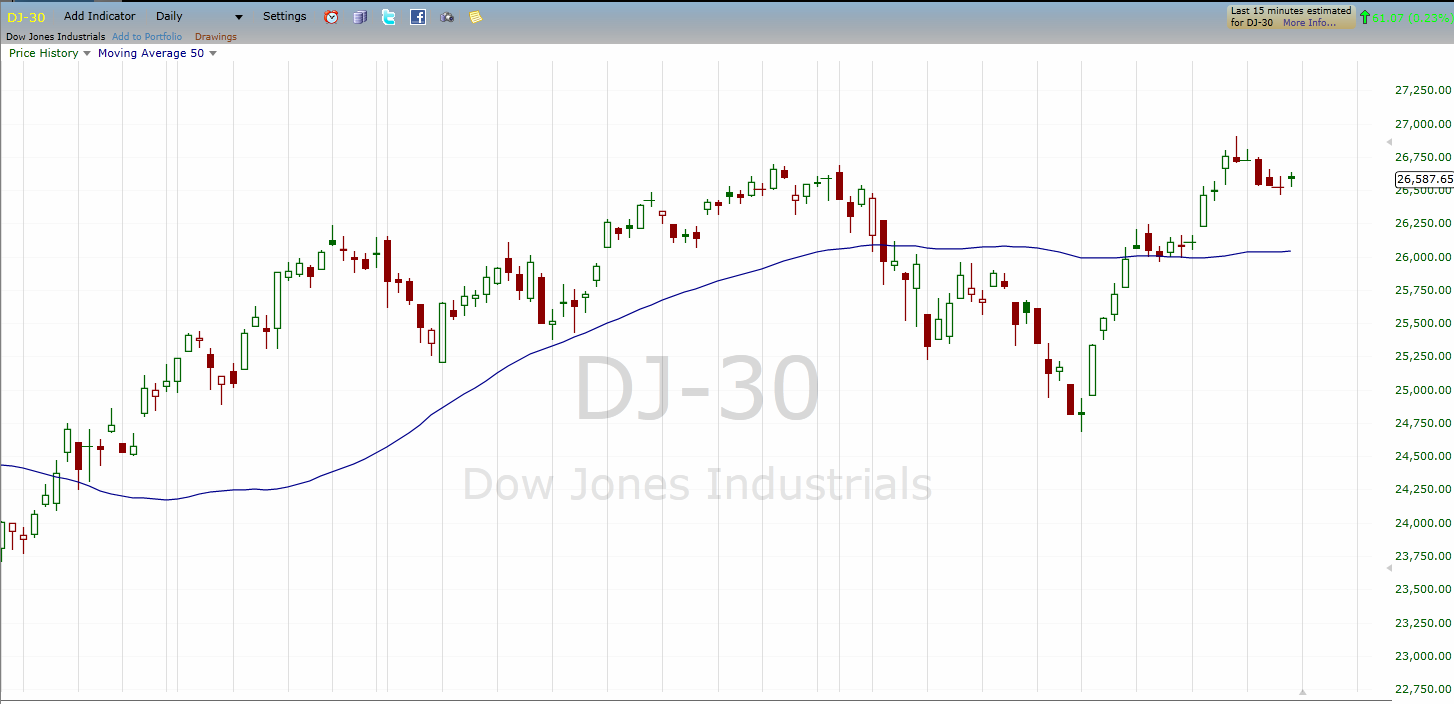
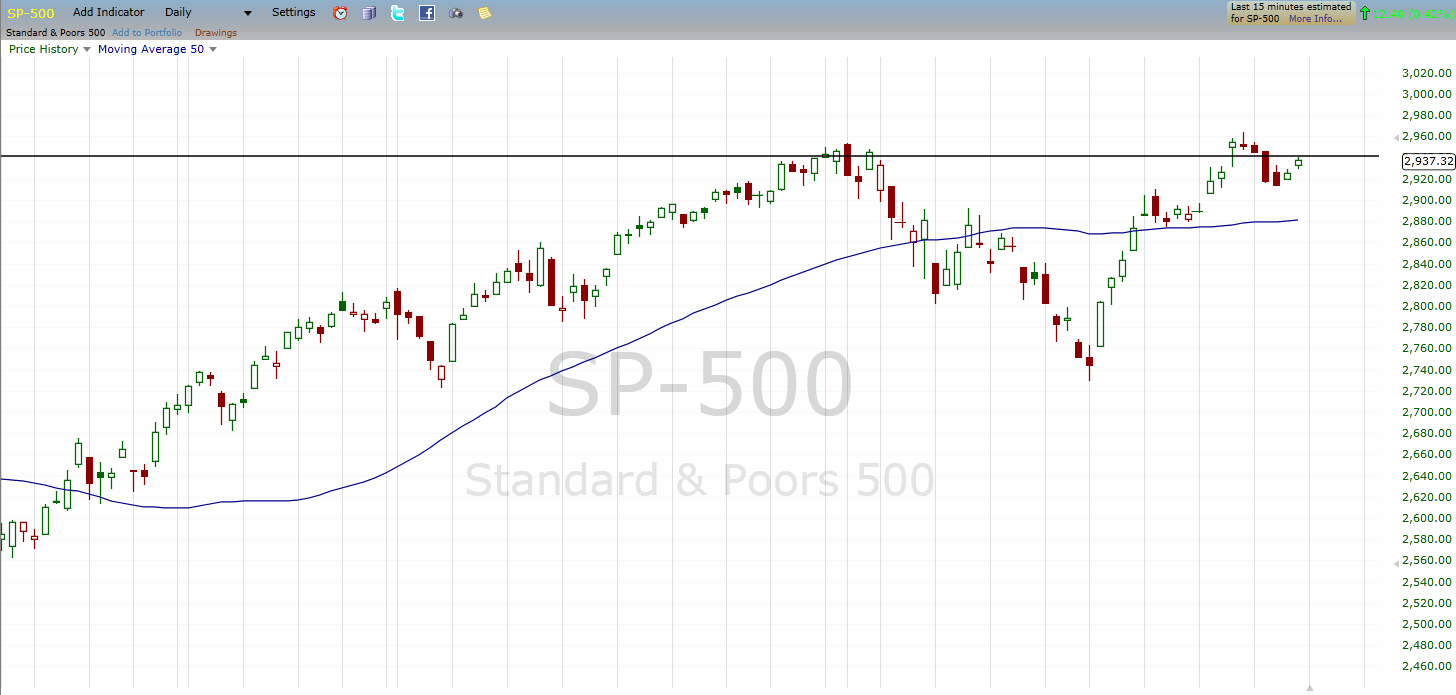
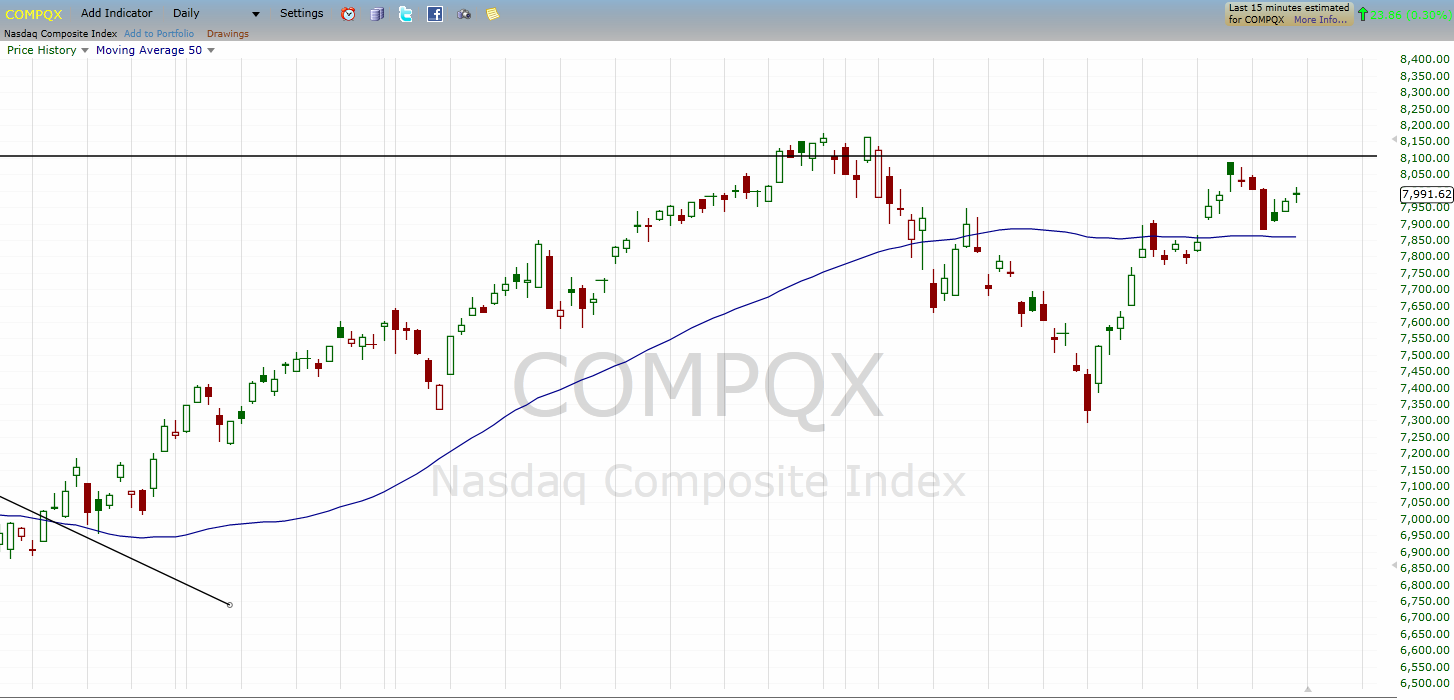
Take a look at the daily charts below to see what is happening with the overall market.
DJ-30:

This week we are looking at the daily charts of the major markets. As opposed to last week, where we looked at the monthly charts, this view gives us what is currently happening in the market, not necessarily the “big picture”. Although, the overall trends which we will be trading can be seen. On the DJ-30 chart, you can see that the 50-period simple moving average is still moving up. This puts a slight bullish bias in the overall movements we are seeing. Currently, we saw a bit of a pullback over the last 6 or so trading sessions. These pullbacks will often times give us a good area to look at price bouncing back up again and a place where we can look to take trades. We will see if the price can break above the longer term resistance and make another run higher.
SP-500:

On last week’s monthly chart, we saw how strong the S&P 500 has been through the years. This week we can see on the daily chart that it is sitting right near the longer term resistance. This is a key area that will need to be broken in order to see the long term trends continue. Right now, we see that price is trying to break out of this week's down move by bouncing higher. If price movement fails to push up, we may see price begin to trend back down over the next couple of months. We know that these cycles are good for the market and can give us a good idea of when we should be looking to buy and when we should be looking to sell.
NASDAQ:

The daily chart of the NASDAQ shows more of weakness that what we saw on the other two charts. The last high from a week ago is clearly lower than the high shown on the chart. Anytime we see price action creating lower highs, it can be a sign of pending weakness. The next key level on this chart is to see if price breaks down below the 50 period simple moving average. If it does this, we may see the beginning of a more extended down move.
Take some time to review how your trades have been doing over the first half of 2019. If you are doing well, keep on doing what you are doing. If you haven’t done so well, take some time to review what you need to do better. Learning how to exit trades properly can help you improve the statistic you are having. Remember, next week is a holiday week so make sure you are using good risk management in all your trades.
