The "fat cat bankers" of Wall Street have seen some of that fat trimmed off them so far this month!
The financial sector ETF, NYSE:XLF, is the worst performer of all the major sector ETFs, shedding more than 2% on the month to date. This performance is particularly disappointing compared to defensive sectors like consumer staples (NYSE:XLP) and utilities (NYSE:XLU), each of which is rising by more than 2% over the last two weeks and change. It's also worth noting that financial stocks have struggled despite the fact that investors have solidified their expectations for a Fed rate hike next month, usually a bullish sign for large financial firms.
So is the long-awaited collapse of the global financial system, when hordes of disenfranchised, socialist, Bernie-Sanders-supporting millennials take to the streets to demand their fair share of the economic pie, finally at hand?
Somehow, we doubt it.
As it often does with financial stocks, it all comes down to the yield curve. While the yields on short-term treasury bonds continue to skyrocket, yields on longer-term bonds remain more subdued. To wit, the yields on the 3-month, 1-year, 2-year, and 3-year treasuries have all hit 8+ year highs, but the yields on longer-term bonds like the benchmark 10-year treasury remain locked in the middle of their yearly ranges.
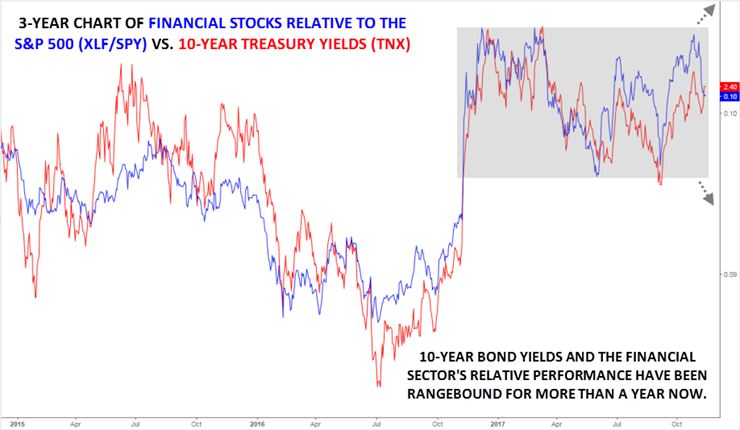
This is a textbook example of the yield curve "flattening," and represents one of the biggest risks for many banks and other financial institutions, which typically make profits borrowing short-term funds (through products like savings accounts and CDs) and lending out funds over a longer-term horizon (through business, auto, and mortgage loans). As the chart below shows, the financial sector's performance relative to the broader S&P 500 (blue) has been closely tracking the yield on the 10-year treasury bond (red) for more than three years now:

Financial stocks were able to outperform the broader market in Q4 of last year, especially in the wake of the election, but for the last 11 months, they've generally tracked the S&P 500. In order to see financial stocks start outperforming again, the chart above suggests that we'll need to see the 10-year bond yield break above the 8-month high at 2.45% and especially the year's high near 2.60%. Such a move would signal that traders expect inflationary pressures to pick up meaningfully.
As long as the 10-year treasury yield remains in this year's well-trodden 2.1-2.6% range, financial stocks may struggle to excel, at least relative to the broader market.
