
Trading position (short-term, my opinion; S&P 500 Futures contract): In my opinion, the short-term outlook is neutral, and no positions are currently justified from the risk/reward point of view.
The S&P 500 index extended its Tuesday’s decline after bouncing from the 4,800 level on Friday. It closed 0.56% lower yesterday, but significantly higher than the daily low of around 4,715. On Friday, the market reached a new medium-term high of 4,802.40, before retracing some of the advance. As mentioned on December 21, “the likely scenario is a consolidation along 4,700-4800”, and this prediction remains accurate.
Currently it looks like the S&P 500 index is going to further extend a consolidation following November-December rally. Expectations before the opening of today’s trading session are positive. How can we capitalize on such trading action? It’s better to shorten the timeframe of the trades and look for buying opportunities at support levels and selling at resistance levels.
In late December and early January, the S&P 500 sold off, reaching its lowest point on Friday since December 13 - the day that marked a pivotal shift in the Fed’s monetary policy, and on Friday, it reached a new yearly high, getting closer to the January 4, 2022, all-time high of 4,818.62 again.
Investor sentiment has slightly worsened; yesterday’s AAII Investor Sentiment Survey showed that 40.4% of individual investors are bullish, significantly lower than the week ago. The AAII sentiment is a contrary indicator in the sense that highly bullish readings may suggest excessive complacency and a lack of fear in the market. Conversely, bearish readings are favorable for market upturns.
This morning, the S&P 500 futures contract is trading 0.5% higher, indicating positive open for the S&P 500 index. There’s an uncertainty due to more mixed economic data and upcoming quarterly earnings releases. Investors will wait for more important earnings reports next week. This week, we've seen some generally better-than-expected earnings from the largest banks.
The market may see more consolidation following November-December rally, as we can see on the daily chart.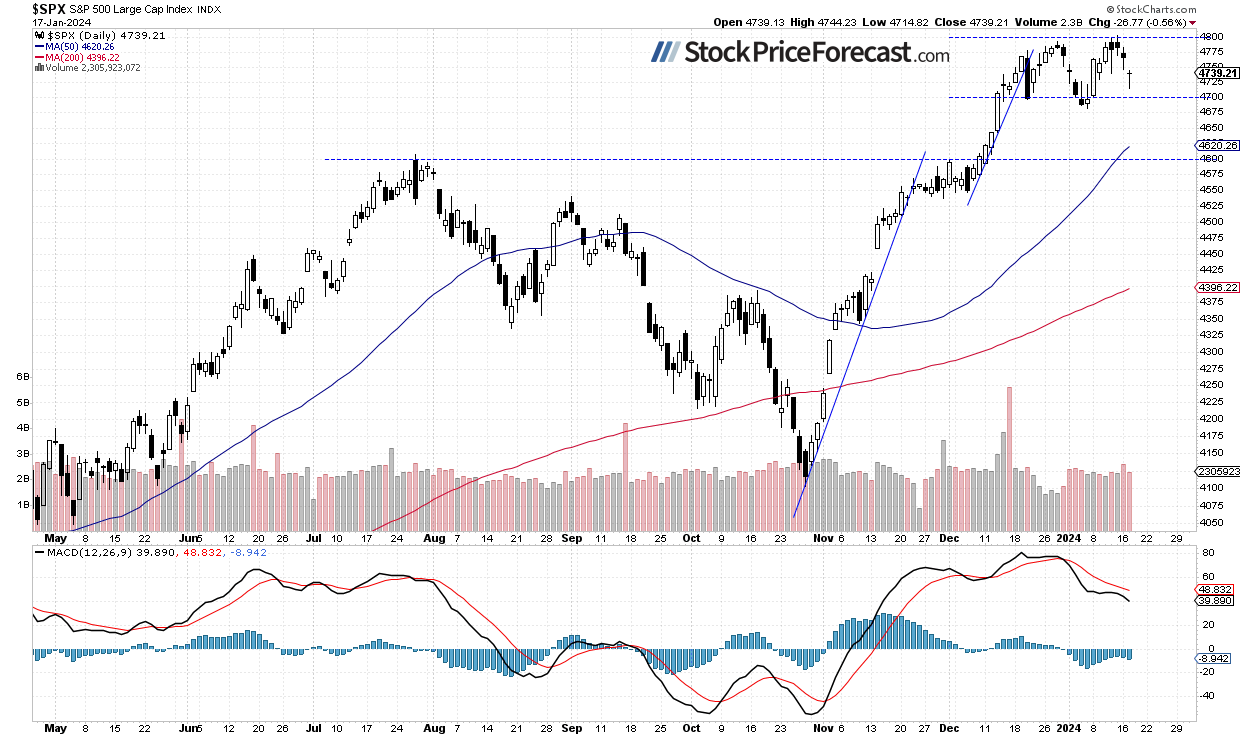
Nasdaq Continues to Consolidate within a Trading Range
Recently, the technology-focused Nasdaq 100 index was extending its uptrend, reaching a new all-time high of 16,969.17 on Thursday, December 28. On December 29, I wrote, “While it continues to trade above its month-long uptrend line, there are, however, short-term overbought conditions that may lead to a downward correction at some point.” Indeed, the market experienced a sharp sell-off then.
Last week on Monday, it bounced sharply, and later it continued the advance. On Wednesday, the Nasdaq 100 closed above the last Tuesday’s daily gap down of 16,687-16,758, which was a positive signal, and on Friday, it went as high as 16,900. However, the question of whether it will break the 17,000 mark remains open.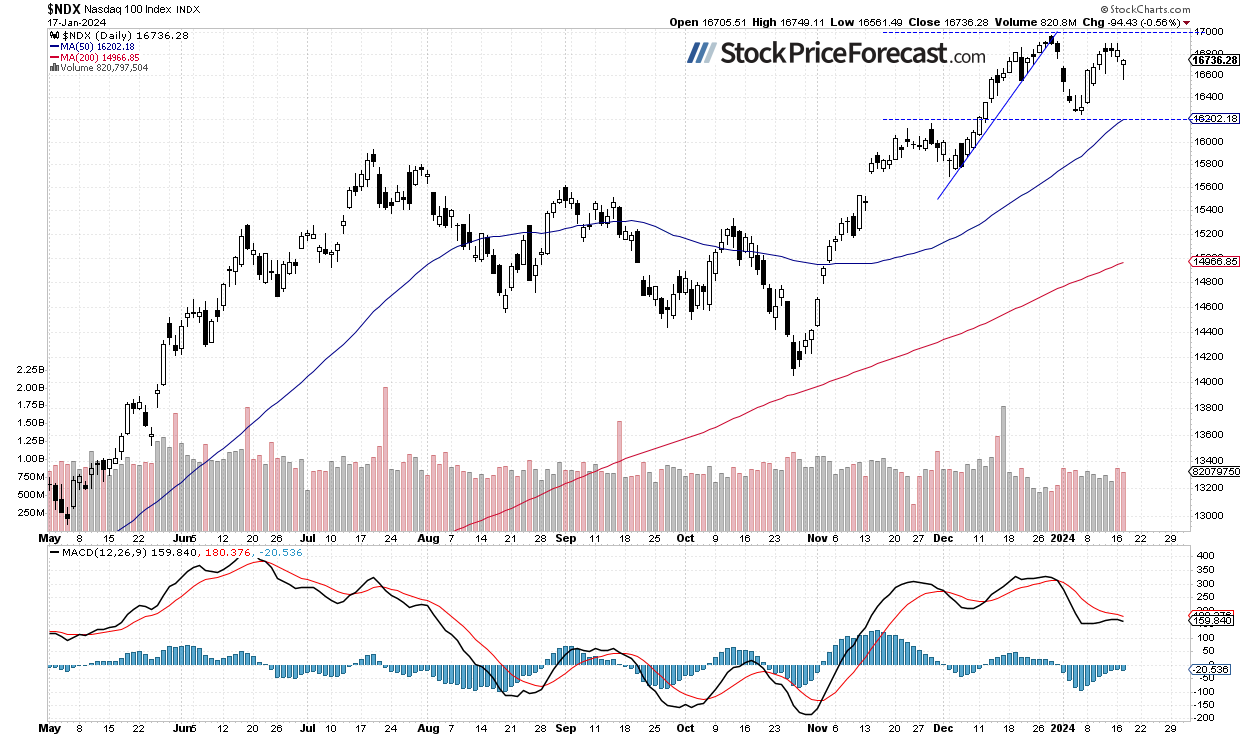
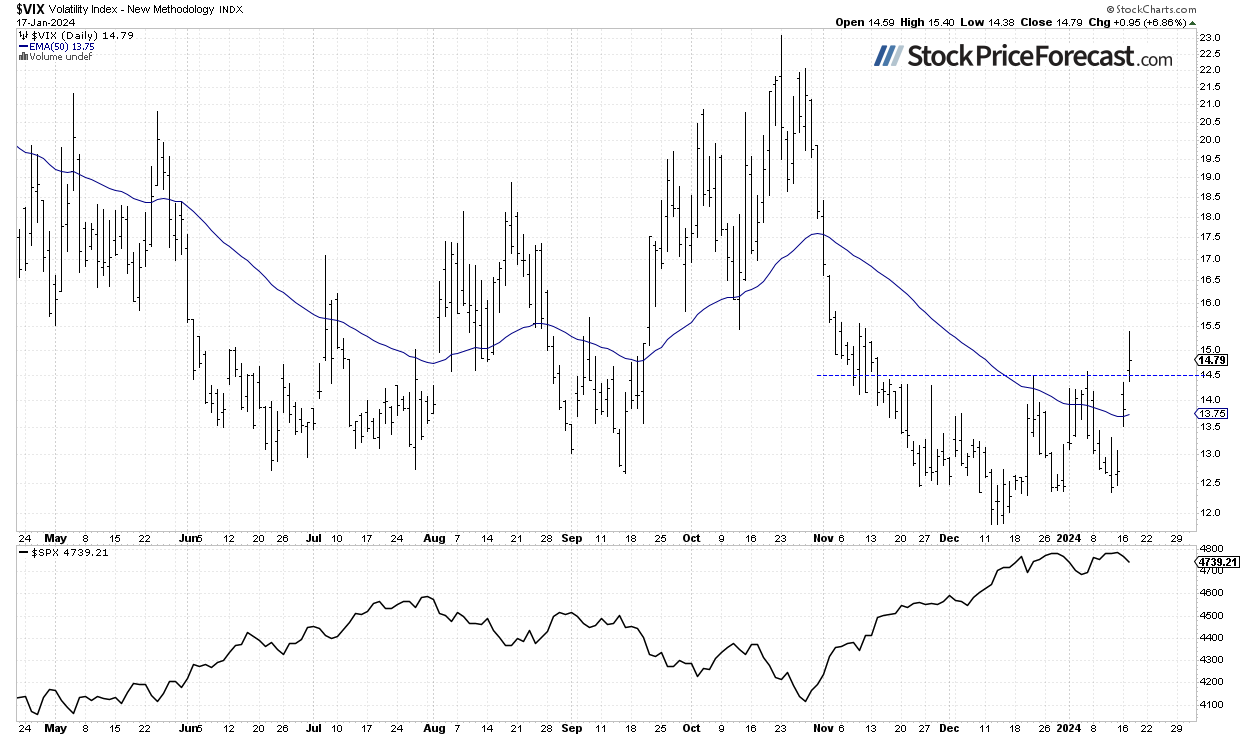
VIX Broke Higher
The VIX index, also known as the fear gauge, is derived from option prices. A week ago, it bounced down from the previous highs around the 14.0-14.5 level, which was a positive signal. It then traded along its local lows around 12.5, and yesterday, the volatility index broke above the recent highs following intraday sell-off in the stock market.
Historically, a dropping VIX indicates less fear in the market, and rising VIX accompanies stock market downturns. However, the lower the VIX, the higher the probability of the market’s downward reversal.
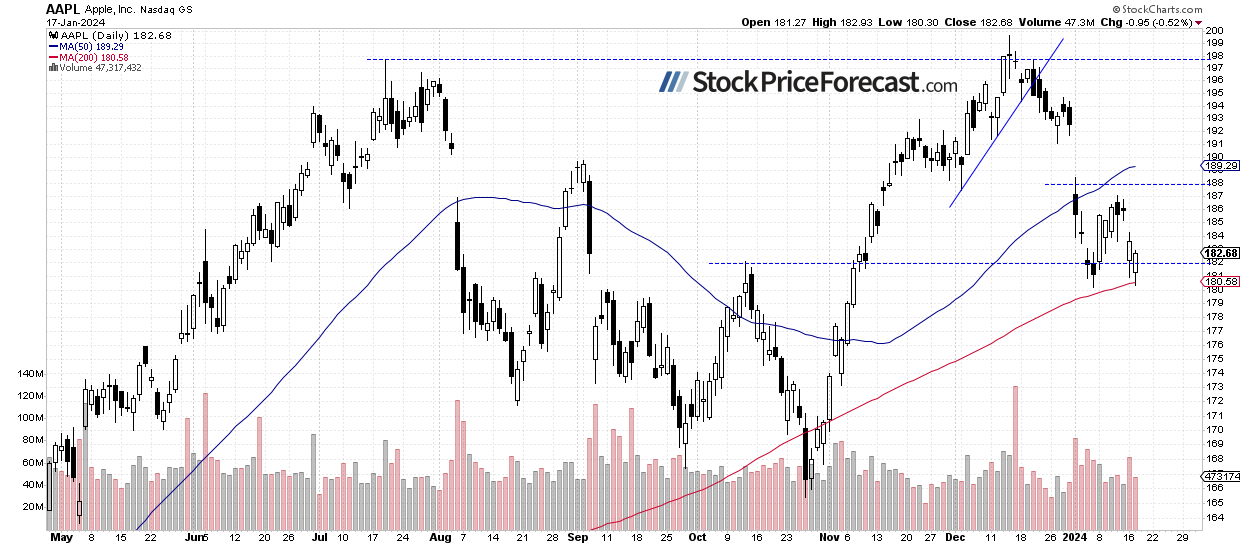
Apple (NASDAQ:AAPL) at Support Level
Let’s move on to an individual stock – Apple, which is one of the most important market movers. In the previous week, it experienced a sharp sell-off. The decline has been significant, suggesting a change in trend. On January 8, I wrote that “(…) the stock approached a potential support level of around $180.” and “The market may see a rebound here.”.
This prediction held true, however, yesterday, Apple sold off closer to that support once again. It remains relatively weak compared to the surging Nvidia (NASDAQ:NVDA) stock, the most recognized AI play, which continued to reach new all-time highs. As for Apple, a potential resistance level remains at $188-190. This morning it’s expected to open over 2% higher, bouncing from the mentioned support level.
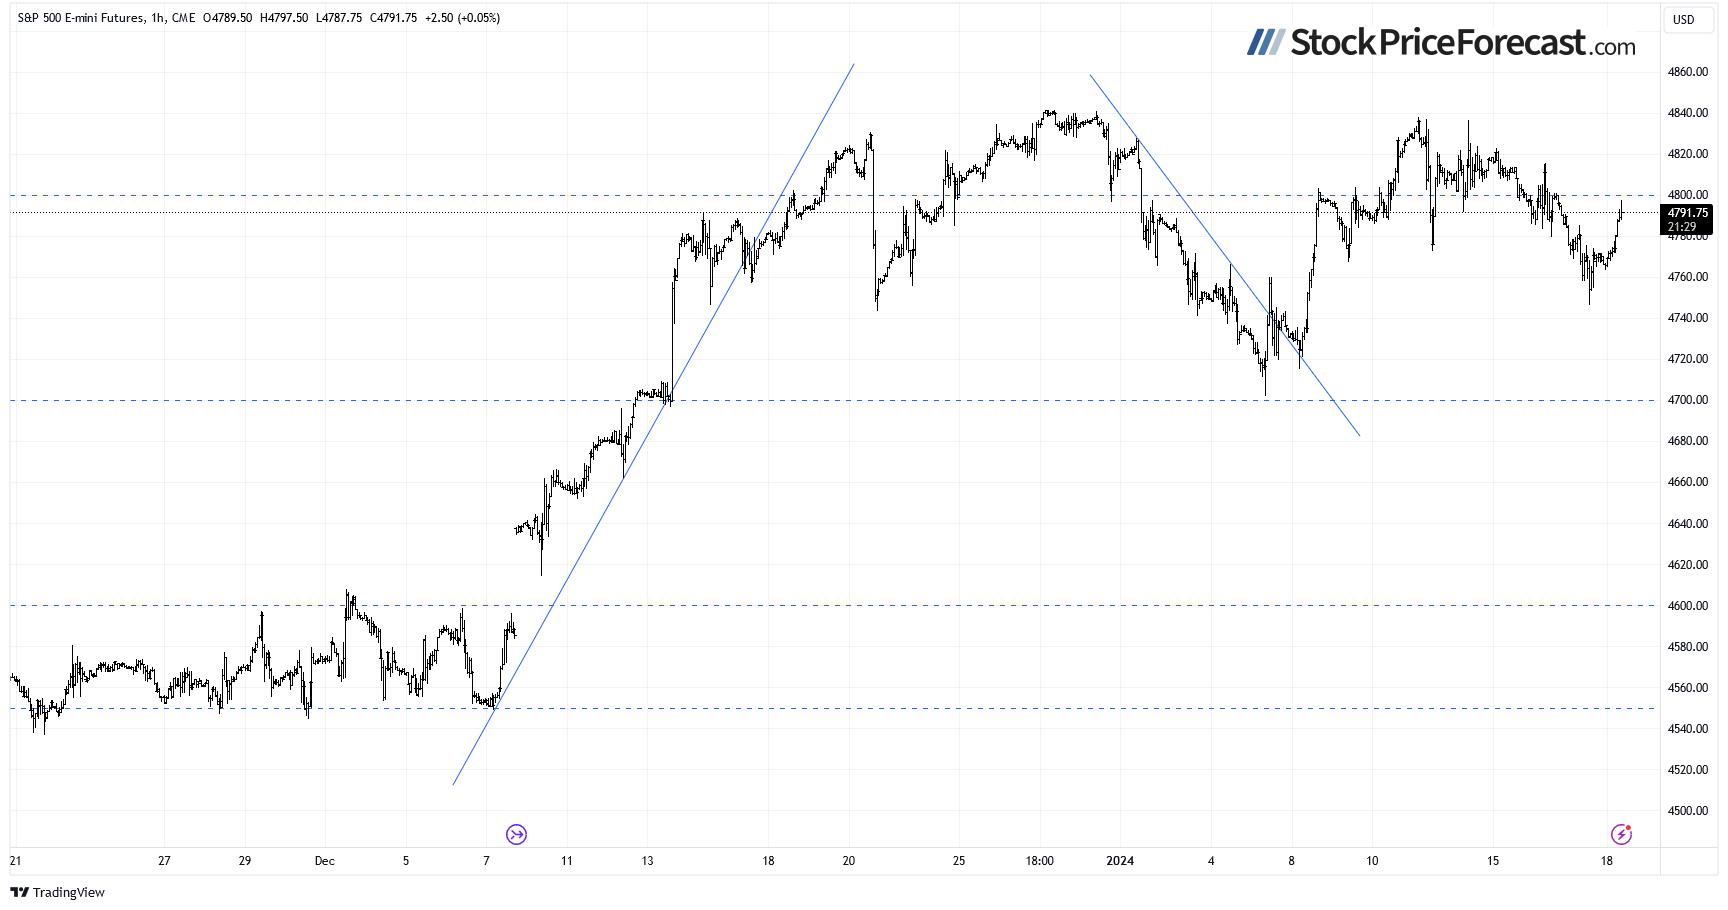
Futures Contract Is Closer to 4,800 Again
Let’s take a look at the hourly chart of the S&P 500 futures contract. On Friday, it approached its previous high of around 4,840 again. This level still stood as the important short-term resistance, and the market retraced a large part of its recent advances. Yesterday, the daily low was at around 4,746, and today, it’s trading near the 4,800 mark again. The resistance level remains at 4,820-4,840.
Conclusion
The S&P 500 is likely to rebound at the open of today’s trading session, driven by a series of economic data and some earnings releases. The market is poised to continue trading within a month-long consolidation. It’s uncertain whether stocks will resume their medium-term uptrend or simply extend a consolidation following November-December rally. Investors will be awaiting more quarterly corporate earnings releases in the coming two weeks.
On December 21, I mentioned that “in a short-term the market may see some more uncertainty and volatility”, and indeed, there is still a lot of uncertainty following the early-December rally and the breakout of the S&P 500 above the 4,700 level. There is still a chance of extending the medium-term uptrend, as no confirmed negative signals have emerged.
For now, my short-term outlook remains neutral.
I think that no positions are justified from the risk/reward point of view.
Here’s the breakdown:
- The S&P 500 remains relatively close to the 4,800 level, and it may see more attempts at reaching its 2022 all-time high of 4,818.62.
- It still appears more like a consolidation than the start of a new uptrend.
- Short-term uncertainty and volatility may favor trading based on support and resistance levels.
- In my opinion, the short-term outlook is neutral, and no positions are justified from the risk/reward point of view.