Get 40% Off
👀 👁 🧿 All eyes on Biogen, up +4,56% after posting earnings. Our AI picked it in March 2024.
Which stocks will surge next?
Unlock AI-picked Stocks

Stocks May Be Forming A Trend Reversal

Published 02/19/2021, 02:39 AM
Updated 09/20/2023, 06:34 AM

Thursday was nearly a repeat of Wednesday. However, the S&P 500 couldn’t make it back to the flat line. Instead, the index finished the day lower by 44 bps to close at 3,913. The index fell by as much as 1% at one point but found some support around 3,890 which has been a solid level since the beginning of the month.

The big question is if the series of lower highs and lower lows is the start of something bigger. It is notable, and another down day tomorrow could really start to form a trend. A drop below 3,890 certainly puts us closer to my target of 3,780 over the near-term.
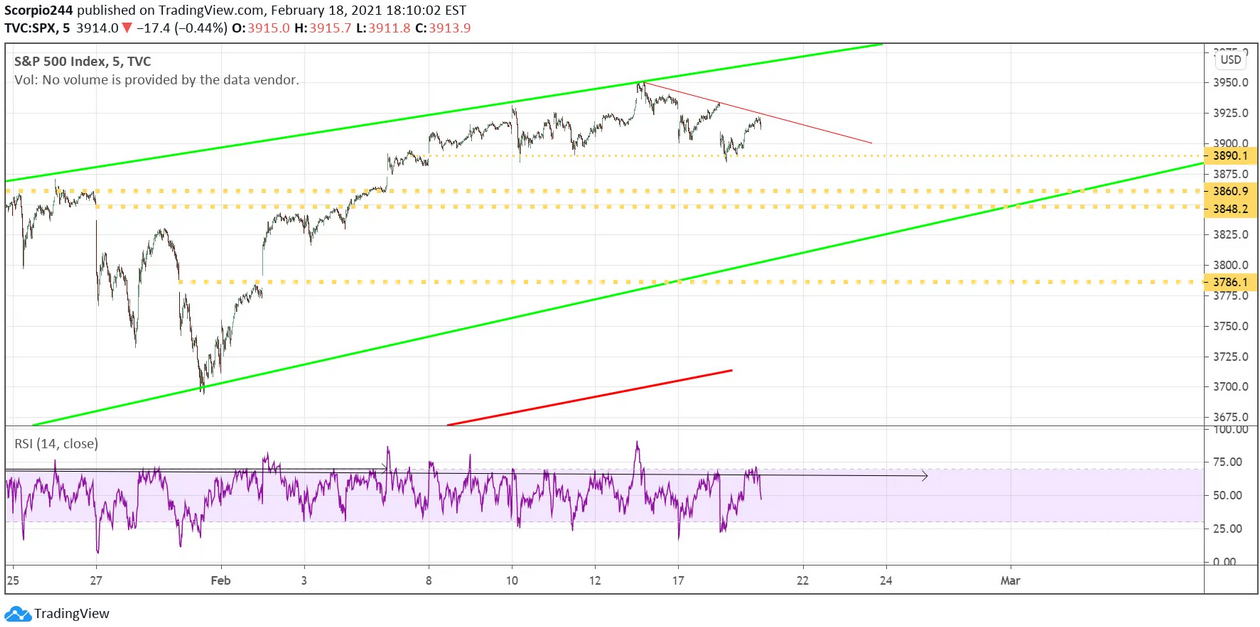
SPX Chart

VIX ETF

The UVXY continues to see its market value rise, which is the most bizarre thing. This isn’t the type of product you “buy and hold”; it is really meant for short-term trading, maybe hedging. But you can see the market value is now over $2.5 billion, and it is rising despite the VIX direction.
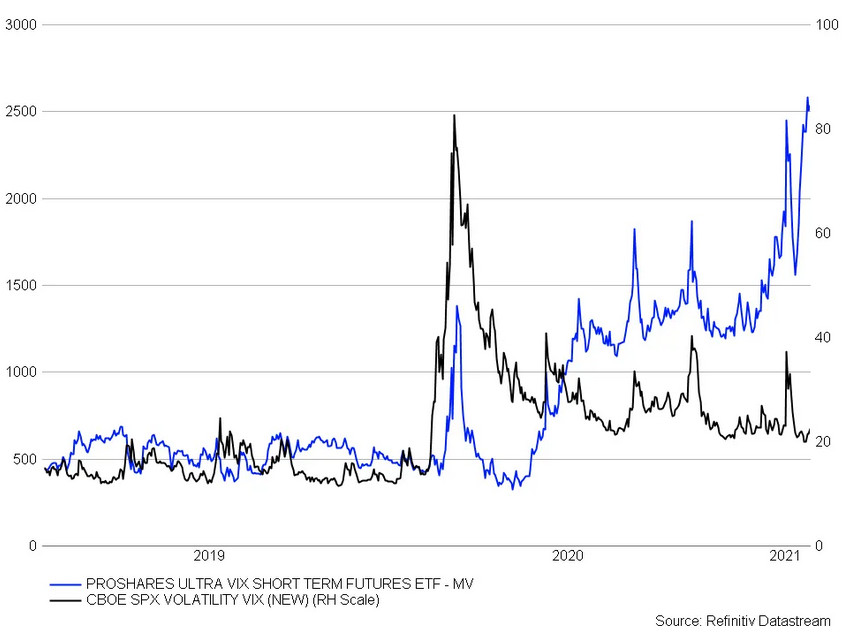
Proshares Ultra VIX Short Term Futures ETF Chart

Again, you can see from the chart below that going buy and hold isn’t a good idea. So again, maybe people think they are playing long volatility, and they are if you think it will happen over the next couple of days. Otherwise, it is decaying asset value. All of these levered ETFs have the same issue; they have a decay component because they are repriced overnight. I don’t know all the details, but that much I know.
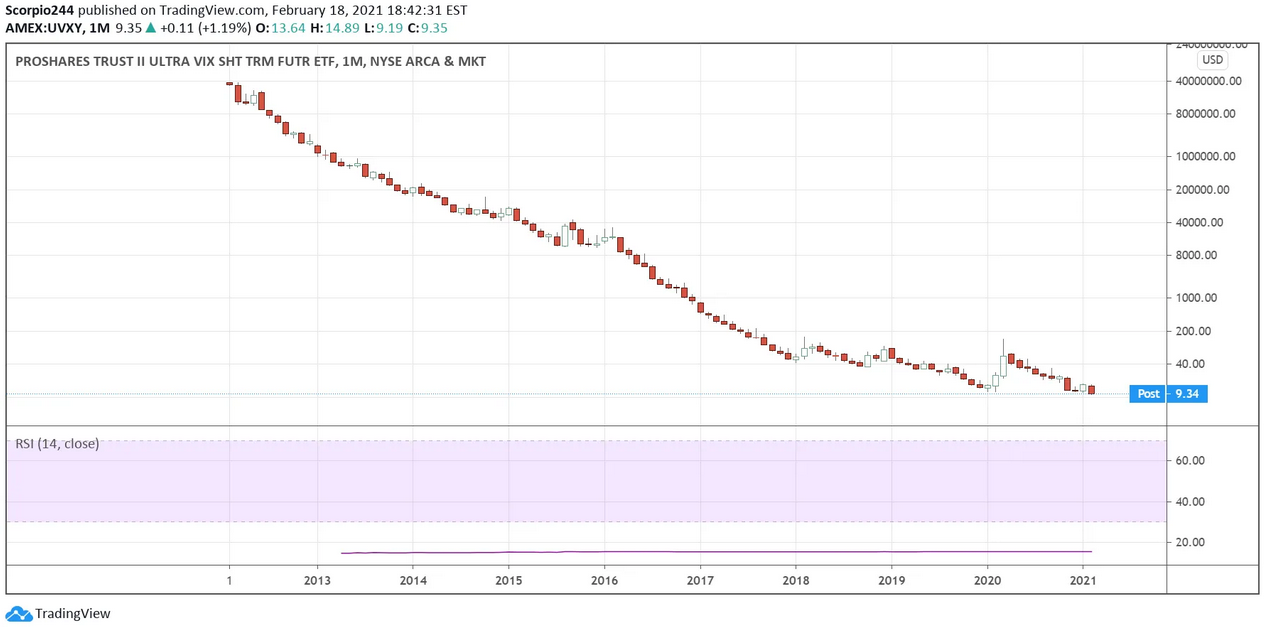
Proshares Ultra VIX Short Term Futures ETF Monthly Chart

3rd party Ad. Not an offer or recommendation by Investing.com. See disclosure here or remove ads .

Roku

Roku (NASDAQ:ROKU) reported really stunning results on both the top and bottom lines. The guidance seems to be the problem, with the company noting tougher year-over-year comps in the second half. We have heard this type of commentary from a number of other companies this quarter, and the market doesn’t seem to like it. So the stock isn’t trading higher in the after-hours; it is just flat. However, that also makes me think that the stock is more than likely to trade lower once it opens. It seems that the stock is likely to head lower to the trend line at $427.
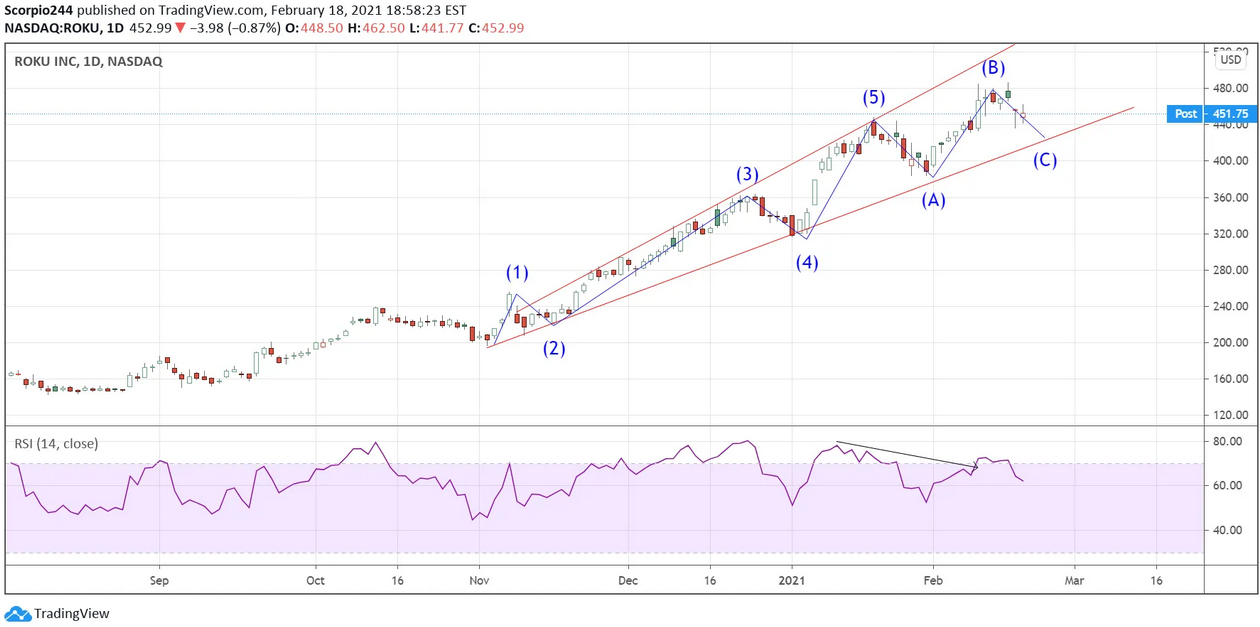
Roku Inc Daily Chart

Boeing

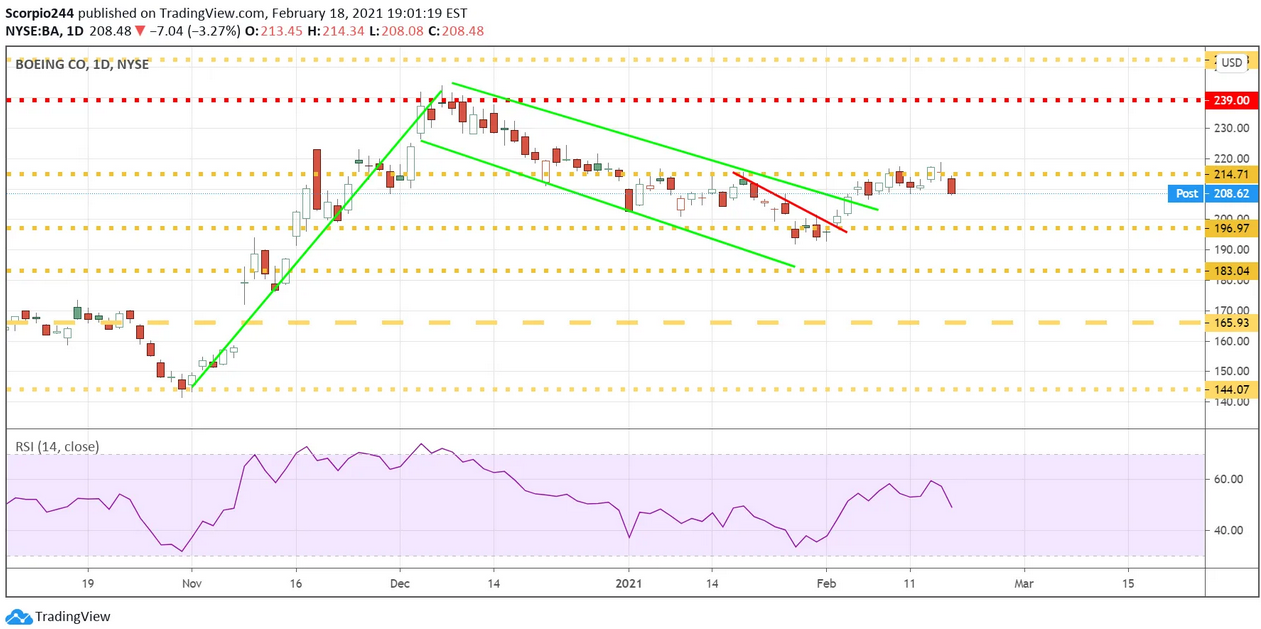
Boeing (NYSE:BA) has failed to break out, and at this point, it needs to be watched for a decline back to $196.
Boeing Co. Daily Chart

AMD

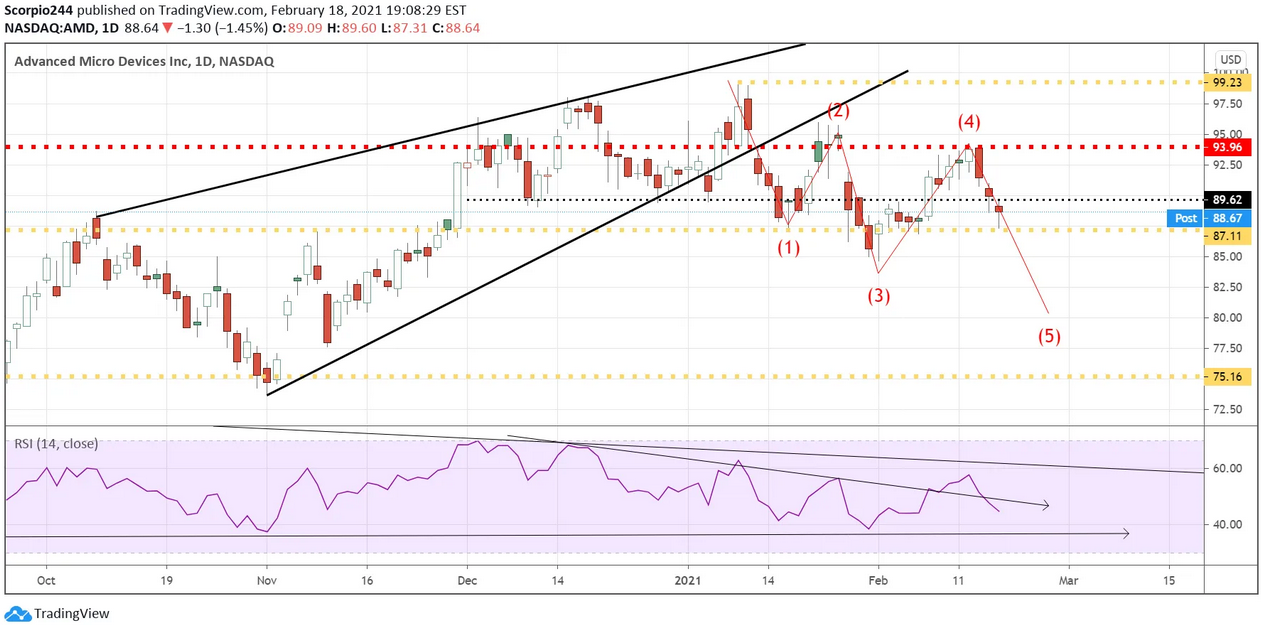
Advanced Micro Devices (NASDAQ:AMD) had another bad day and tested support at $87.10 again. The stock is likely not finished falling and is working towards completing its 5 wave pattern, perhaps to the gap fill at $75.20.
AMD Daily Chart

Walmart

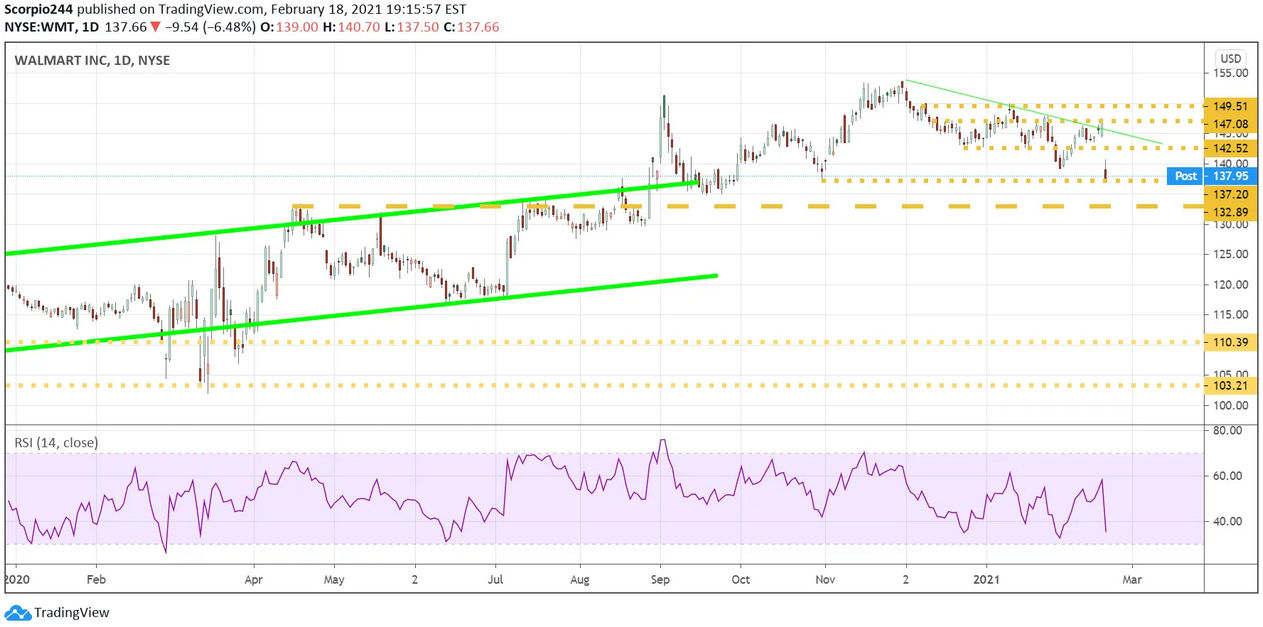
Walmart (NYSE:WMT) looked like it was trying to break out yesterday, which blew up this morning following some cautious commentary on the earnings call. The stock fell by 6.5% and is testing support at $137.95. A dip below that support level would likely indicate a drop back to the $129 to $132 region.
Walmart Daily Chart

Original Post

Latest comments

funny to click on a 2 week old article where an analyst is predicting a drop to potential investors, and 2 weeks later you click on the tickers in the article and they are all up 10%. Kramer your personality is bearish but you definitely don't know technical analysis. your always wrong
Risk Disclosure: Trading in financial instruments and/or cryptocurrencies involves high risks including the risk of losing some, or all, of your investment amount, and may not be suitable for all investors. Prices of cryptocurrencies are extremely volatile and may be affected by external factors such as financial, regulatory or political events. Trading on margin increases the financial risks.
Before deciding to trade in financial instrument or cryptocurrencies you should be fully informed of the risks and costs associated with trading the financial markets, carefully consider your investment objectives, level of experience, and risk appetite, and seek professional advice where needed.
Fusion Media would like to remind you that the data contained in this website is not necessarily real-time nor accurate. The data and prices on the website are not necessarily provided by any market or exchange, but may be provided by market makers, and so prices may not be accurate and may differ from the actual price at any given market, meaning prices are indicative and not appropriate for trading purposes. Fusion Media and any provider of the data contained in this website will not accept liability for any loss or damage as a result of your trading, or your reliance on the information contained within this website.
It is prohibited to use, store, reproduce, display, modify, transmit or distribute the data contained in this website without the explicit prior written permission of Fusion Media and/or the data provider. All intellectual property rights are reserved by the providers and/or the exchange providing the data contained in this website.
Fusion Media may be compensated by the advertisers that appear on the website, based on your interaction with the advertisements or advertisers.
© 2007-2024 - Fusion Media Limited. All Rights Reserved.