Stocks finished mixed on Nov. 30, with the S&P 500 falling by roughly 40 basis points and the QQQ finishing up slightly. Nothing really major developed. Perhaps everyone is waiting for the deluge of data to come this week, with the ISM manufacturing report, the ADP job report on Wed, the ISM services and jobless claims on Thursday, and the BLS job report on Friday.
S&P 500
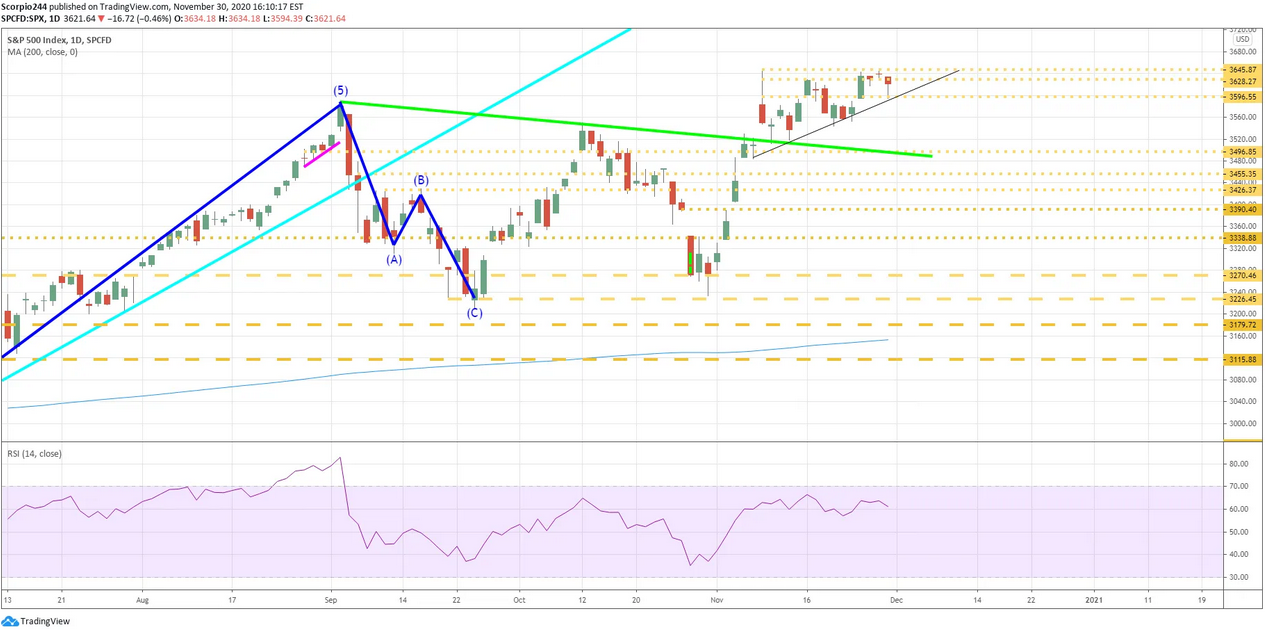
Perhaps there is an ascending triangle forming in the S&P 500 chart, hard to tell at the moment. I could always map it another way like a wedge. So we should take another day to be sure.
Zoom
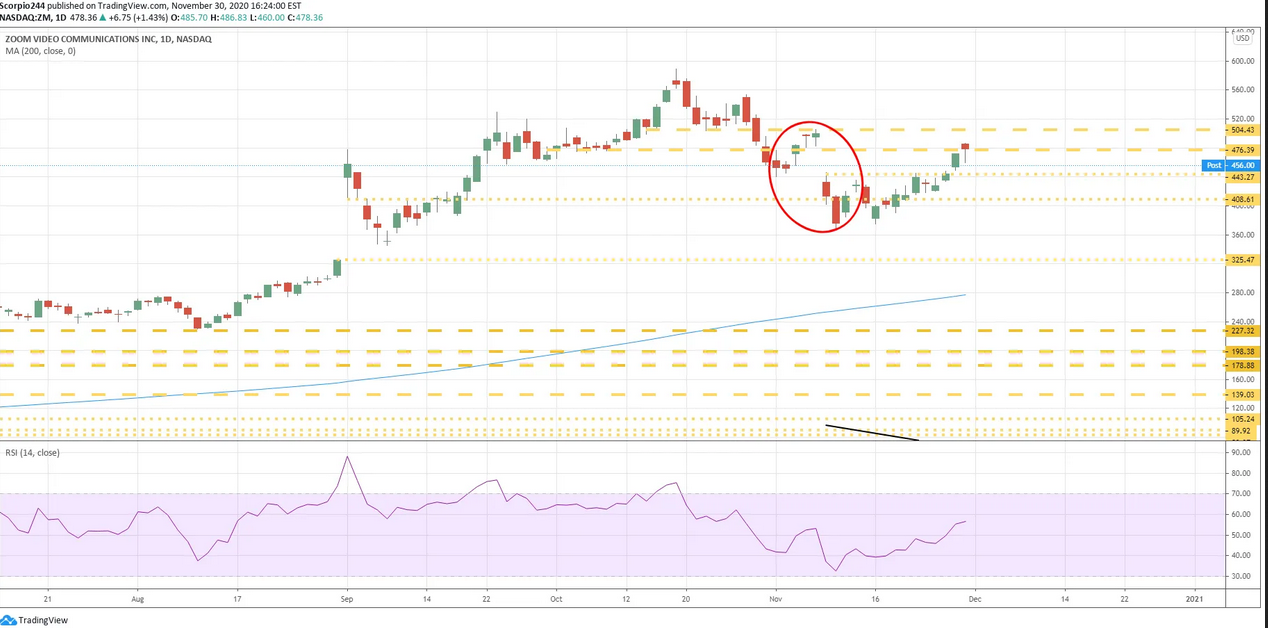
Zoom reported better than expected results on the top and bottom and also provided better than expected guidance. Still, the shares are down about 4% as I write this. It had been down as much as 7%. I’m sure there are plenty out there that think Zoom is the future of something. But remember, for stock to justify this valuation, it will need to grow even faster. Yes! The company is guiding revenue to about $2.6 billion this year. With a market of $134 billion, they will have to grow that revenue to around $7 billion over the next 2 or so years to get that P/S ratio down to 20, $14 billion to get it 10. It depends on how you want to value the company. Not sure they are growing fast enough at this pace. Analysts project revenue of just $3.9 billion by 2023. That will likely come up some.
The gap on Zoom is filled; we should continue to move lower now.
AMD
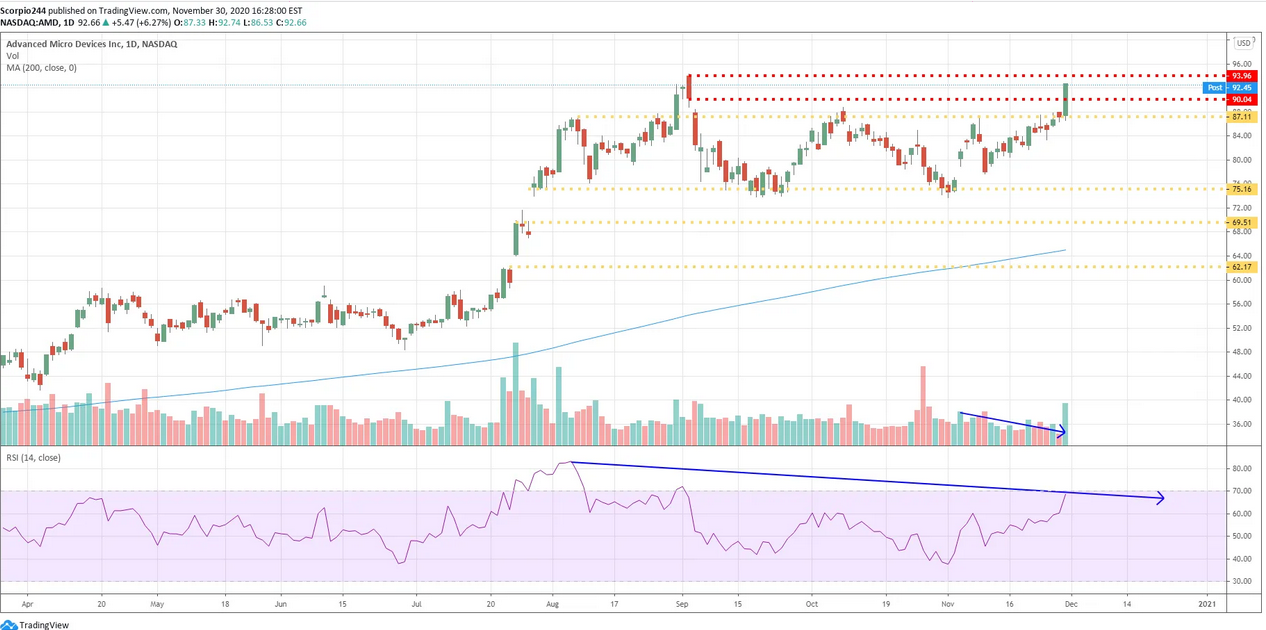
AMD moved up yesterday. No big deal, and not unexpected. I said somewhere; I can’t remember where the stock could retrace one last time to retest the previous high. So we will see clearly a bearish divergence on the RSI with the series of lower highs. Not a good sign. The last line of resistance comes at $94; we will see.
PayPal
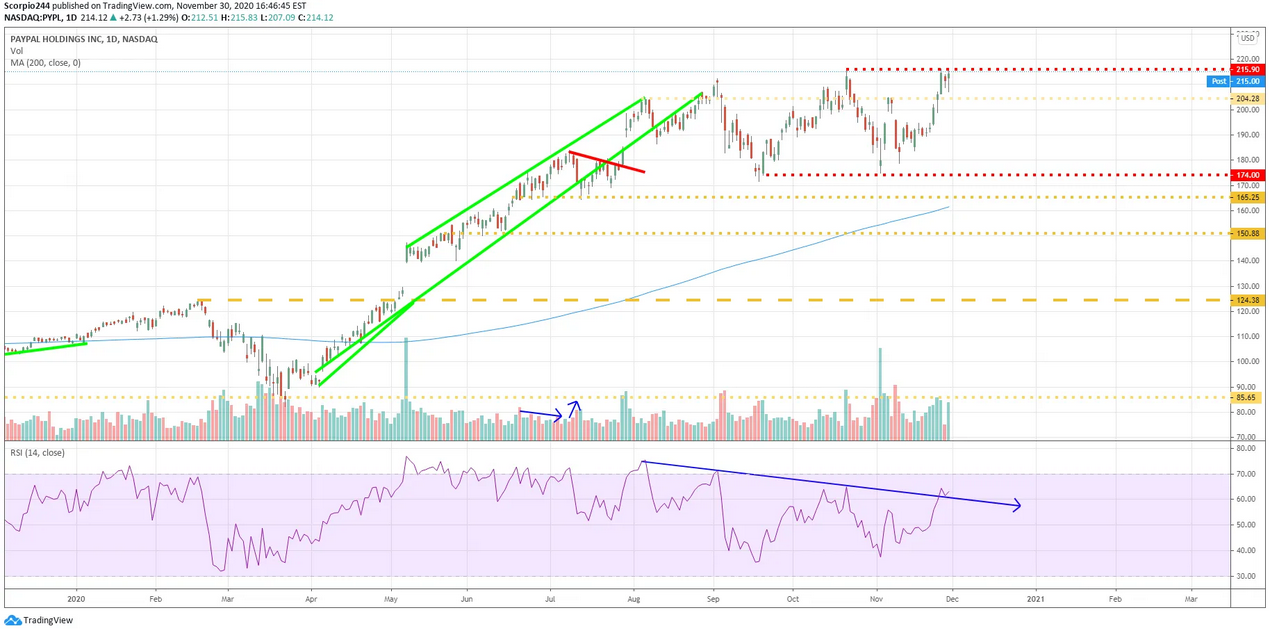
Meanwhile, PayPal is still range bound and yet to break out or break down. We will see on this one too.
Broadcom
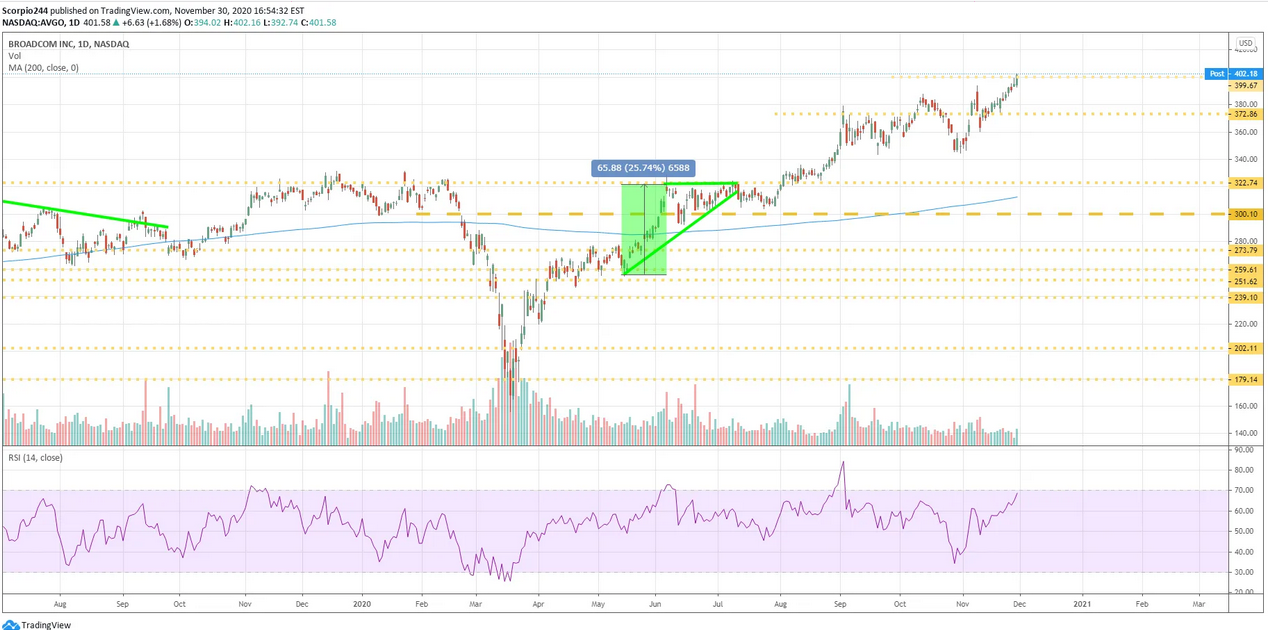
Broadcom (NASDAQ:AVGO) has been steadily risen and is bumping against a resistance level I mapped our around $402. They should be reporting results any day now. The stock is nearing overbought levels, but compared to Nvidia (NASDAQ:NVDA), it seems like a bargain. They both have the same growth by acquisition strategy. But Nvidia trades for 45 times next year’s earnings, and Broadcom trades for just 15.5 times next year’s earnings. Yes, Nvidia is “growing” faster, but come on. Nvidia is a great company, just a bad valuation. But hey, if you think Nvidia is the future of everything, more power to ya.
Roku
Finally, Roku (NASDAQ:ROKU) was up yesterday. For no reason, I could tell of. Perhaps it is having a bit of convexity squeeze here, it is the only thing that explains the movement. You know what is even better than watching Netflix (NASDAQ:NFLX) with your Roku player. Watching Netflix with a pair of Airpod pros on your iPhone 12 Max, or iPad pro. Yeah, it is. No distraction, it is just you and the show, and with amazing surround sound to go with. Think about that! TV will be a thing of the past, maybe not today, but they will be.
