Get 40% Off
👀 👁 🧿 All eyes on Biogen, up +4,56% after posting earnings. Our AI picked it in March 2024.
Which stocks will surge next?
Unlock AI-picked Stocks

Stocks Continue To Face Stiff Levels Of Technical Resistance

Published 06/23/2020, 03:54 AM
Updated 09/20/2023, 06:34 AM

S&P 500

Stocks finished the day higher yesterday, coming back from a move lower in the S&P 500 futures. It was a strange day, because, for some reason, there remains a stiff level of resistance around the 3,115 level in the S&P 500. It has been that way for several days now. I’m not sure what to make of it at this point. It suggests if anything, a tight trading range is forming for the moment, between 3050 and 3150. it wouldn’t be the worst thing in the world to have some sideways consolidation. It would certainly be better than a steep pullback, and better than the markets continuing to get overextended.
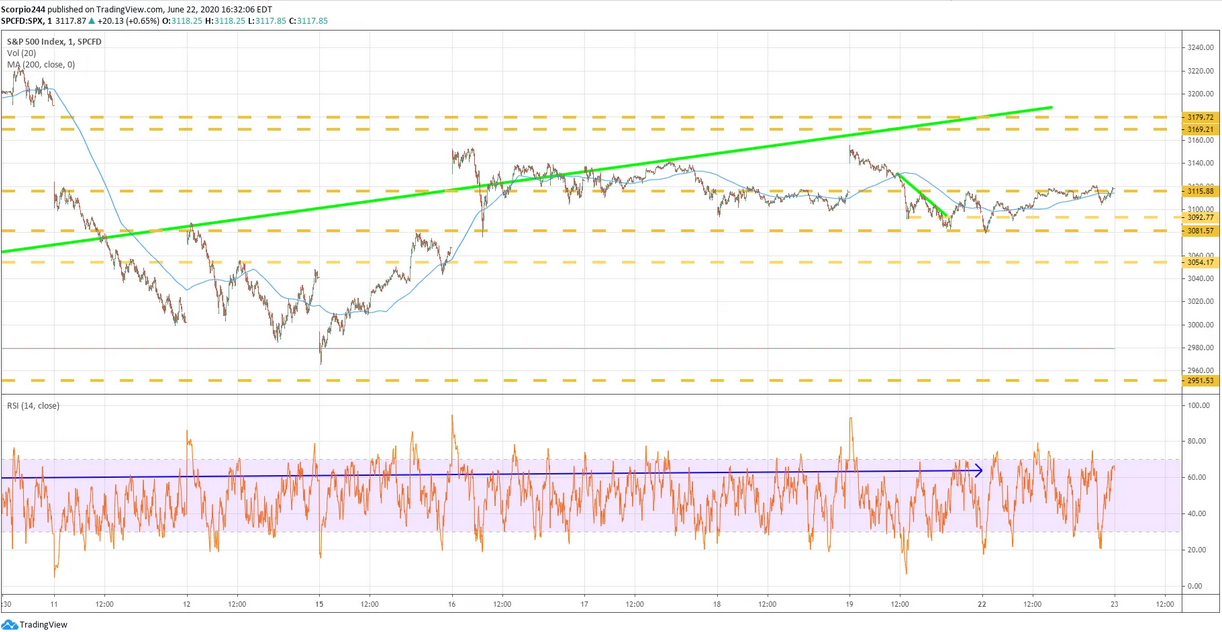
SPX Chart

NASDAQ 100

The QQQs (NASDAQ:QQQ) reached Friday’s highs, and that is where they stopped rising. For the moment, there is nothing new here. It is going to become very important for the QQQs to make a new high in the next few days to keep the bullish momentum going. The QQQs continue to remain in a very well defined trading channel.
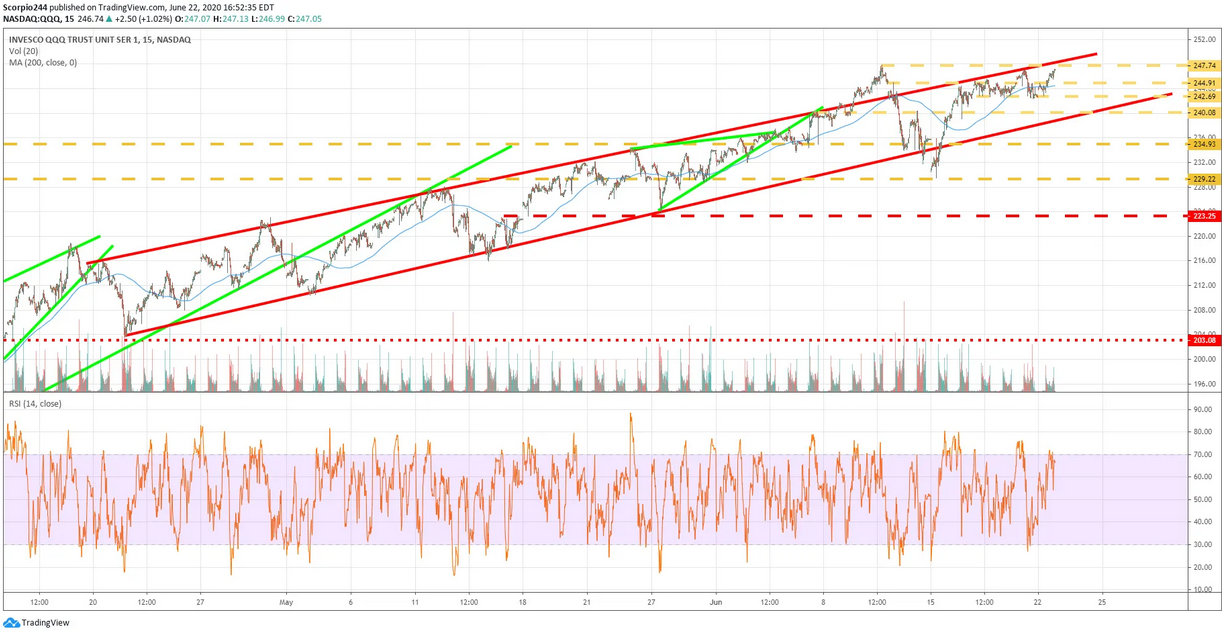
QQQ Chart

From another viewpoint, you can see the QQQs are still on the lower side of the rising wedge pattern I noted two weeks ago. At this point, I think it doesn’t mean much of anything from a bullish or bearish standpoint. Volume levels continue to dry up, which could be an indication the number of buyers is thinning out.
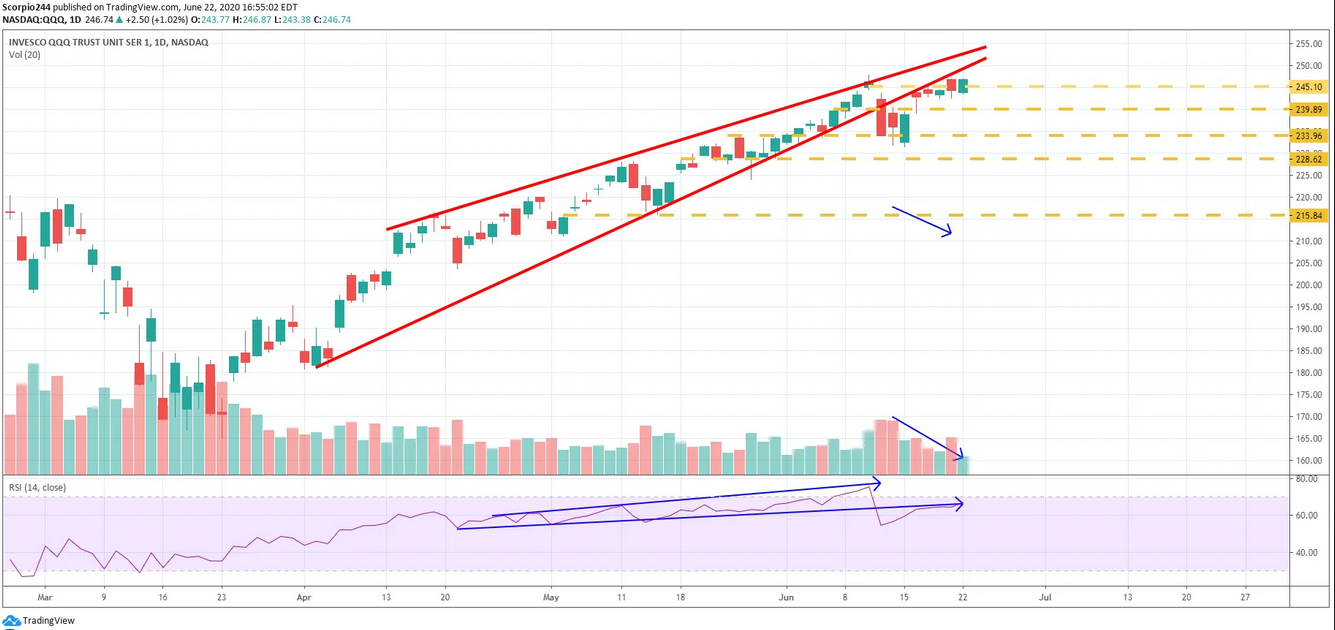
Nasdaq QQQ Chart

Facebook

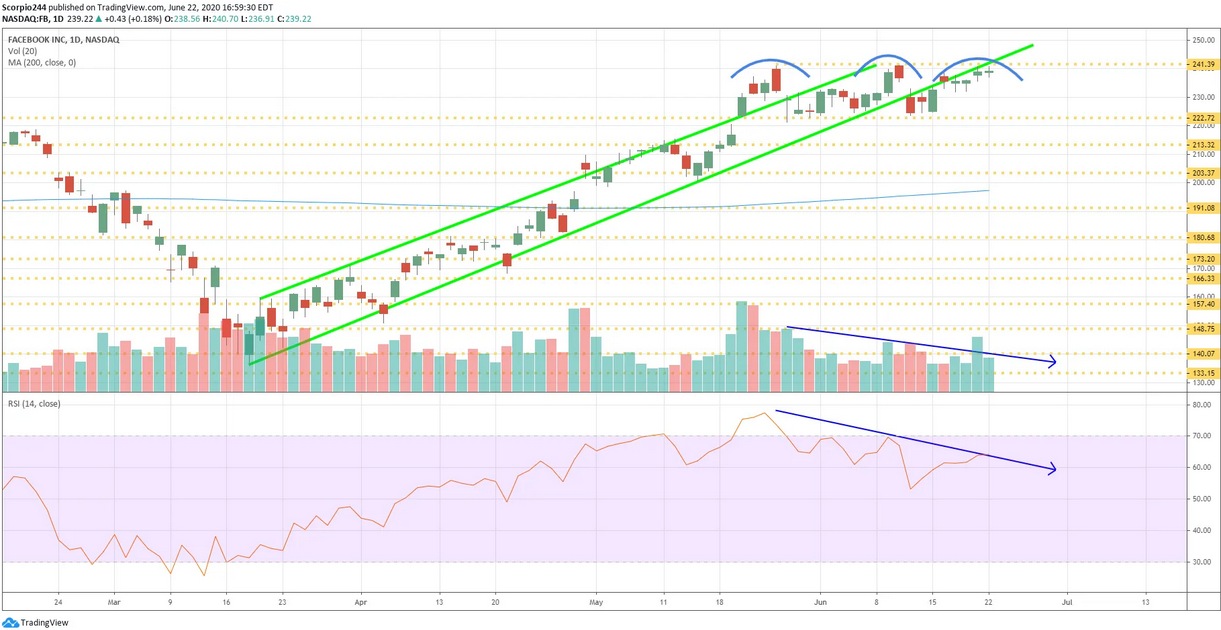
Yesterday saw increased bearish betting on Facebook (NASDAQ:FB), the second time we have seen such bets in the past week.
3rd party Ad. Not an offer or recommendation by Investing.com. See disclosure here or remove ads .

Facebook Daily Chart

Netflix

Netflix (NASDAQ:NFLX) finally broke out, which was desperately needed. It means the stock can avoid that head and shoulders pattern I was fearful was forming.
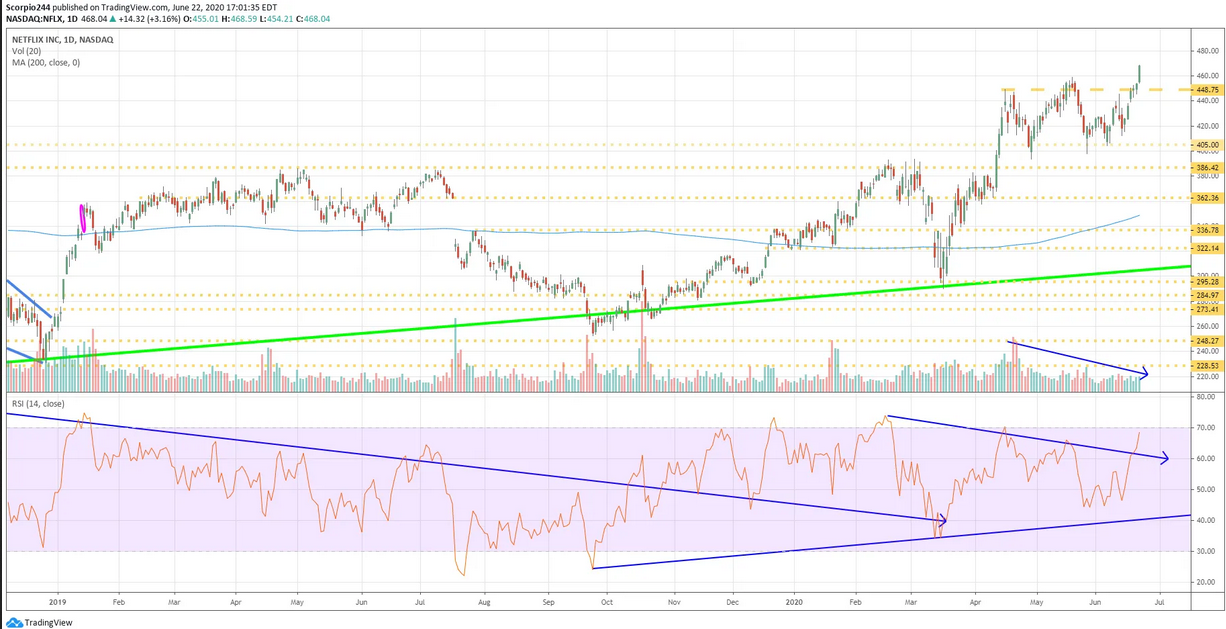
Netflix Daily Chart

Square (SQ)

Square jumped yesterday after getting a price target boost at Barclays to $115 from $90. I still tend to think this one pulls back to $91, but then again, I was wrong as of yesterday.
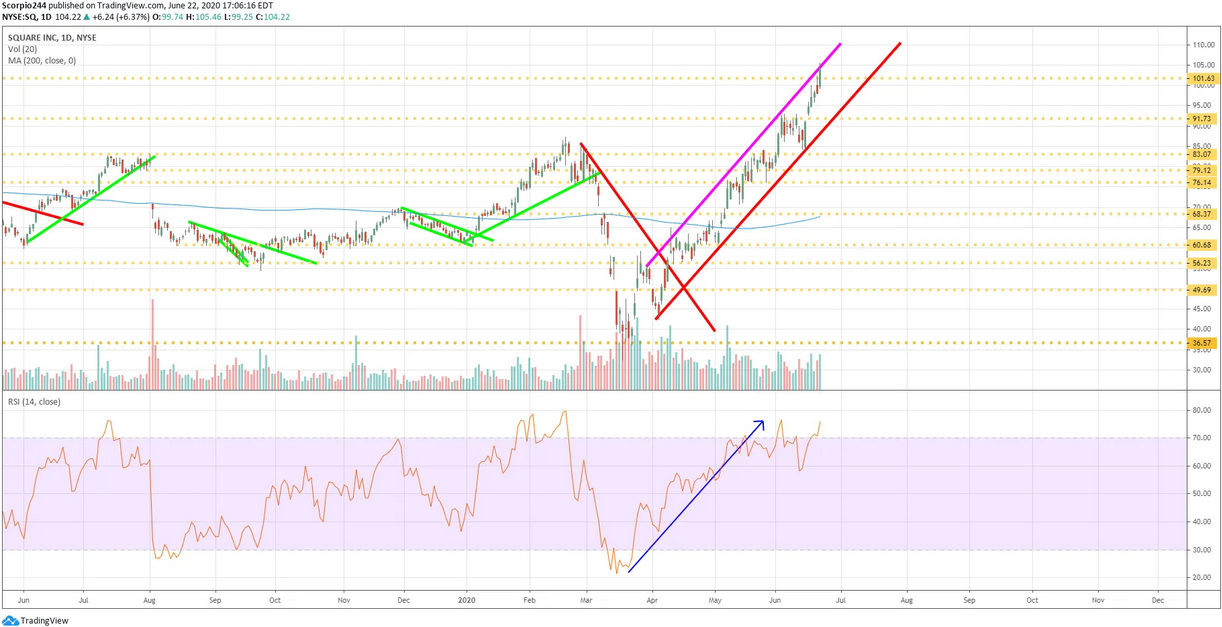
Square Inc Daily Chart

Roku

Roku (NASDAQ:ROKU) failed yesterday at $135, and that is a significant level of resistance it will need to penetrate for that run to $150 I was looking for based on that reverse head and shoulders pattern.
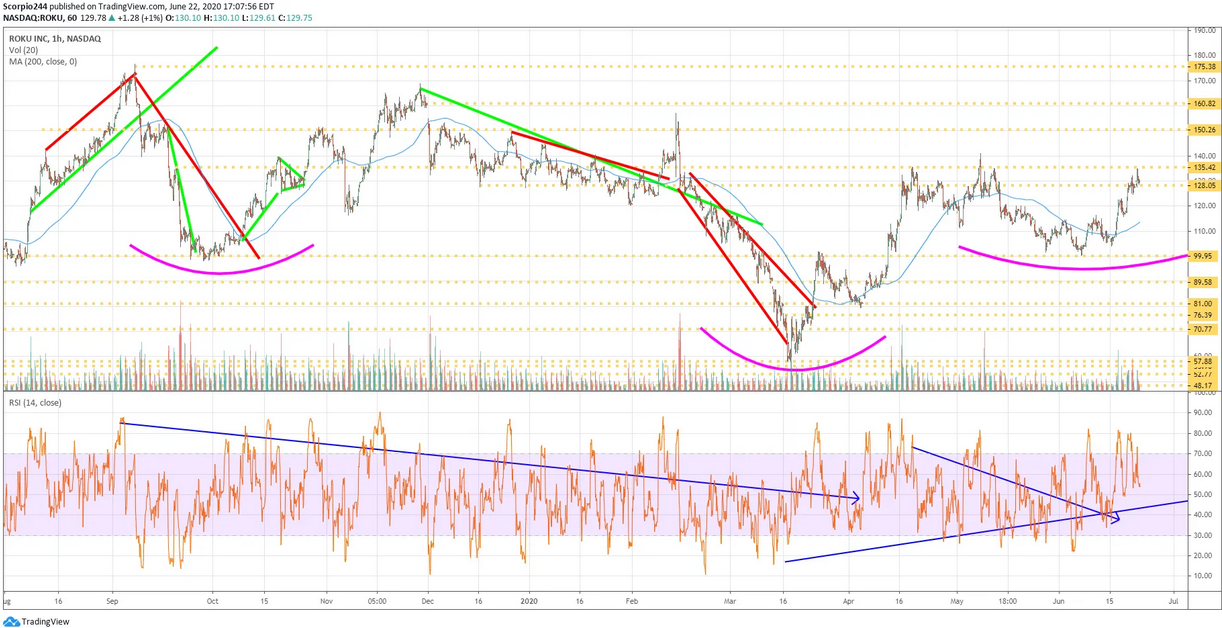
Roku Inc 1 Hr Chart

Original Post

Latest comments

Risk Disclosure: Trading in financial instruments and/or cryptocurrencies involves high risks including the risk of losing some, or all, of your investment amount, and may not be suitable for all investors. Prices of cryptocurrencies are extremely volatile and may be affected by external factors such as financial, regulatory or political events. Trading on margin increases the financial risks.
Before deciding to trade in financial instrument or cryptocurrencies you should be fully informed of the risks and costs associated with trading the financial markets, carefully consider your investment objectives, level of experience, and risk appetite, and seek professional advice where needed.
Fusion Media would like to remind you that the data contained in this website is not necessarily real-time nor accurate. The data and prices on the website are not necessarily provided by any market or exchange, but may be provided by market makers, and so prices may not be accurate and may differ from the actual price at any given market, meaning prices are indicative and not appropriate for trading purposes. Fusion Media and any provider of the data contained in this website will not accept liability for any loss or damage as a result of your trading, or your reliance on the information contained within this website.
It is prohibited to use, store, reproduce, display, modify, transmit or distribute the data contained in this website without the explicit prior written permission of Fusion Media and/or the data provider. All intellectual property rights are reserved by the providers and/or the exchange providing the data contained in this website.
Fusion Media may be compensated by the advertisers that appear on the website, based on your interaction with the advertisements or advertisers.
© 2007-2024 - Fusion Media Limited. All Rights Reserved.