As part of the ongoing process to offer new and up-to-date information regarding seasonal and technical investing, we are adding a section to the daily reports that details the stocks that are entering their period of seasonal strength, based on average historical start dates. Stocks highlighted are for information purposes only and should not be considered as advice to purchase or to sell mentioned securities. As always, the use of technical and fundamental analysis is encouraged in order to fine tune entry and exit points to average seasonal trends.
Stocks Entering Period of Seasonal Strength Today:
Quanta Services, Inc. (NYSE:N:PWR) Seasonal Chart
The Markets
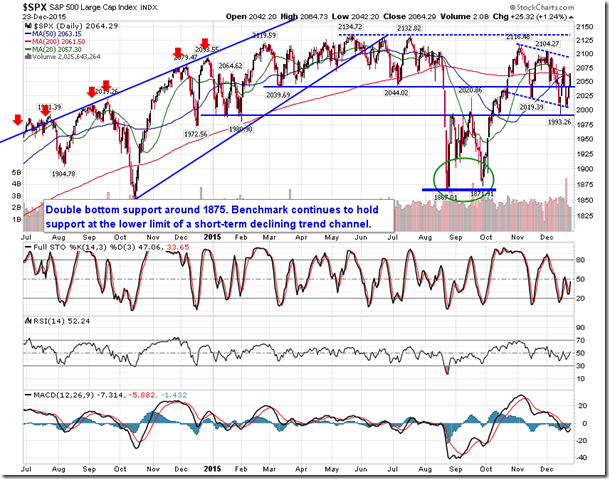
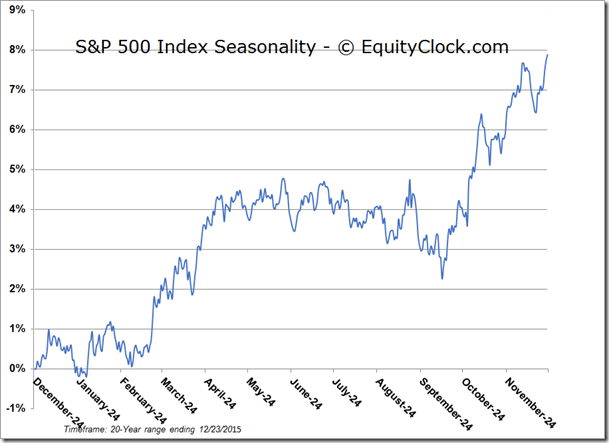
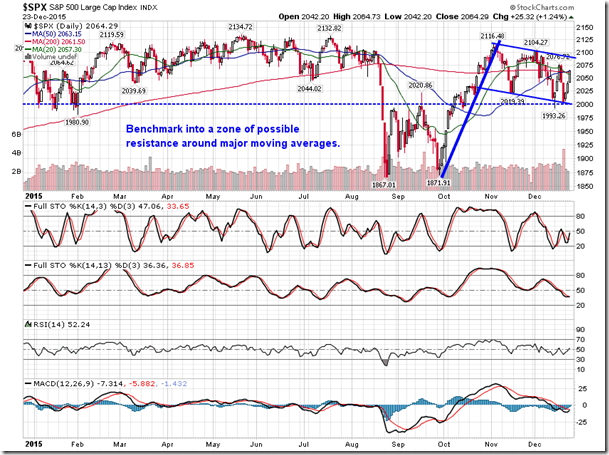
Stocks recorded a third straight day of strong gains as the belief in Santa Claus continues to grow. The S&P 500 Index is now up by 2.92% following the short-term double bottom low charted at the start of the week. As highlighted in yesterday’s report, a key hurdle around 2060 on the S&P 500 Index is upon us ahead as the benchmark battles with the 20, 50, and 200-day moving averages. Should the benchmark overcome this zone, a push beyond the mid-December highs becomes a good probability, and likely a move to the upper limit of the short-term declining trend channel that has constrained trading activity since the start of November. As mentioned a number of times over the past couple of weeks, this short-term declining trend channel forms the basis of what could be a bull flag pattern, confirmation of which would be provided upon a break above the upper limit of the flag portion, now around 2090. Positive seasonal tendencies attributed to the Santa Claus rally period typically continue through to the first couple of days of January.
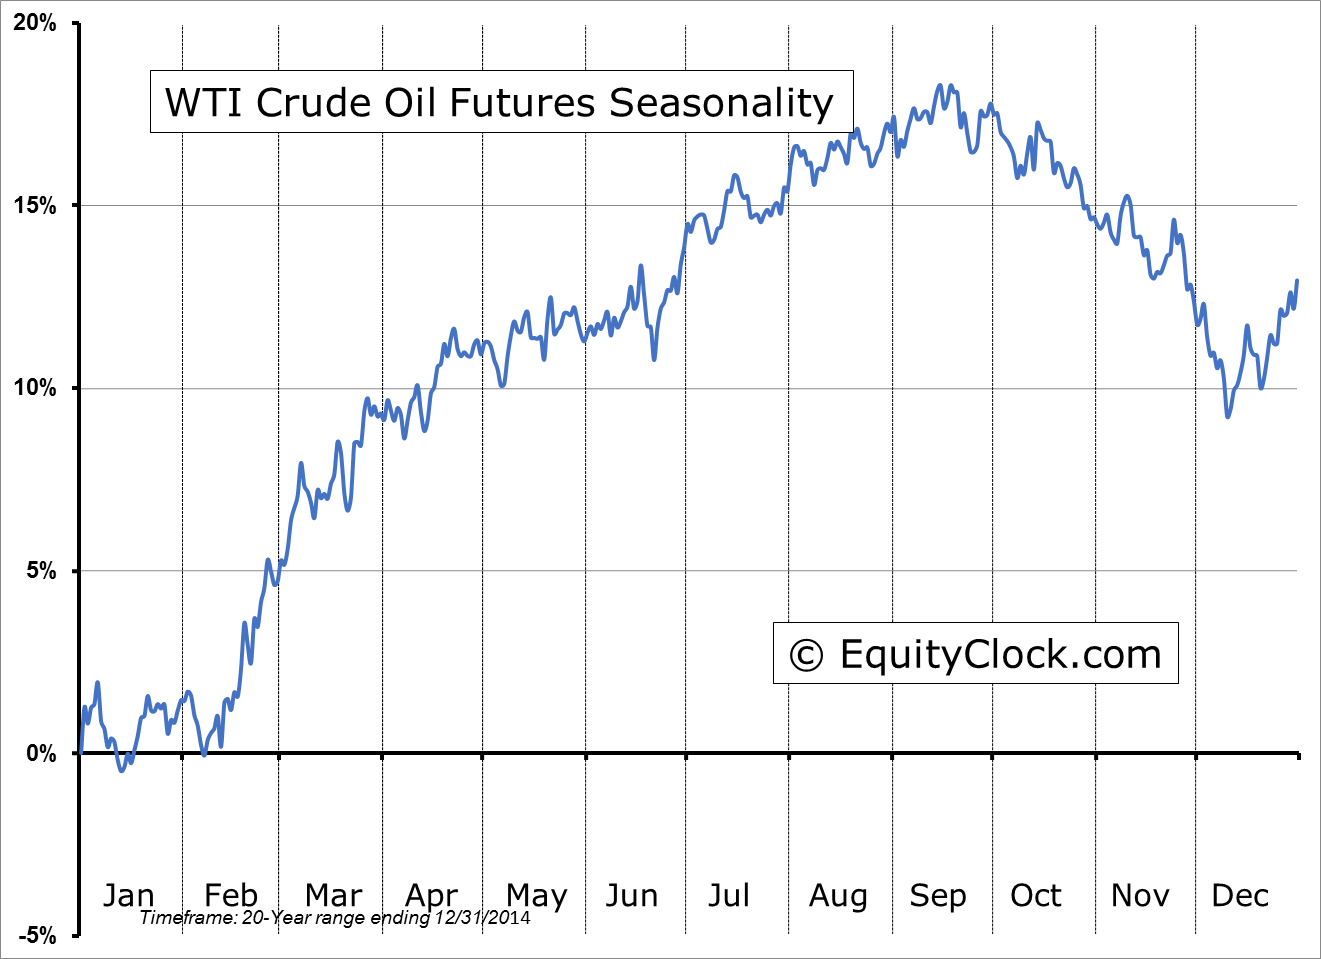
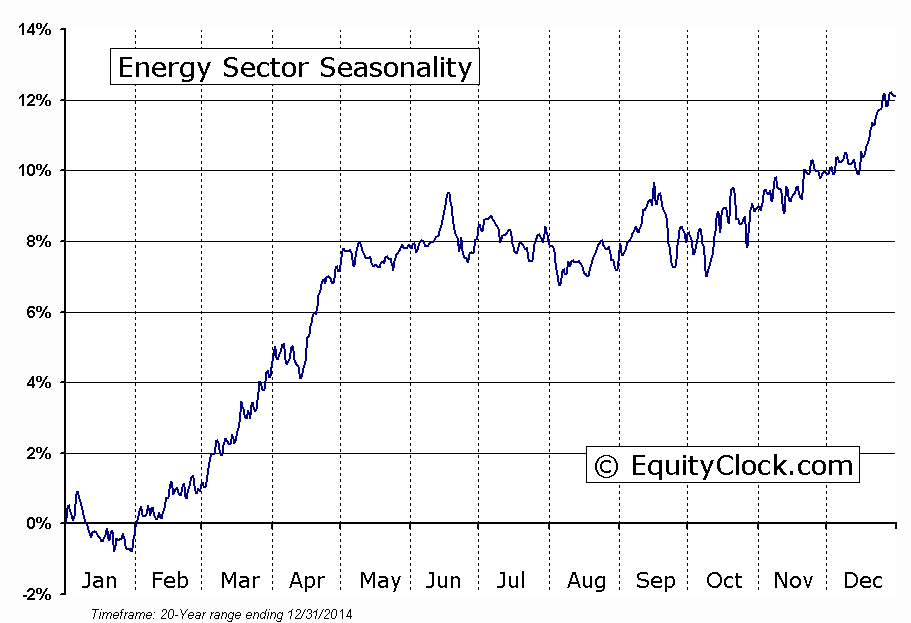
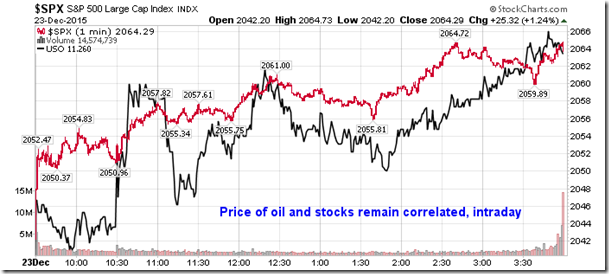
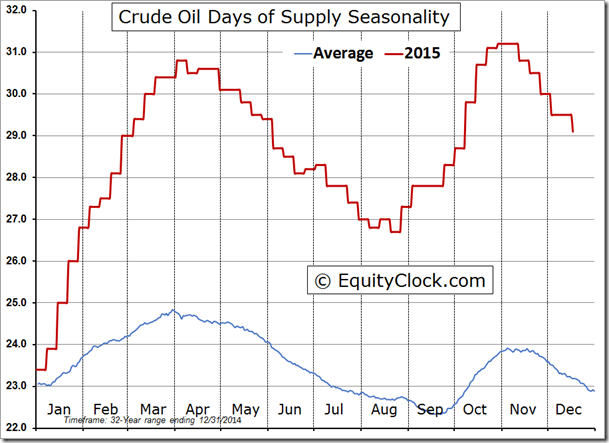
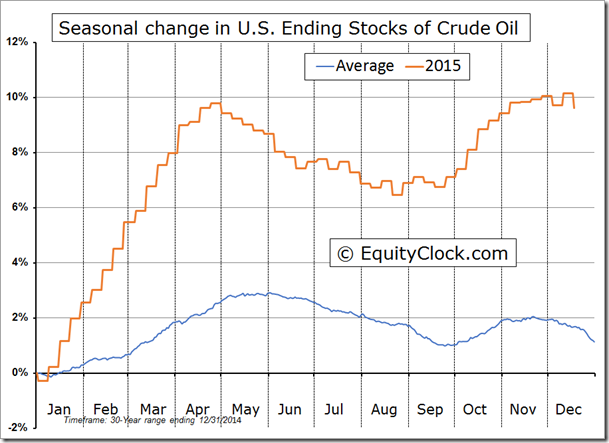
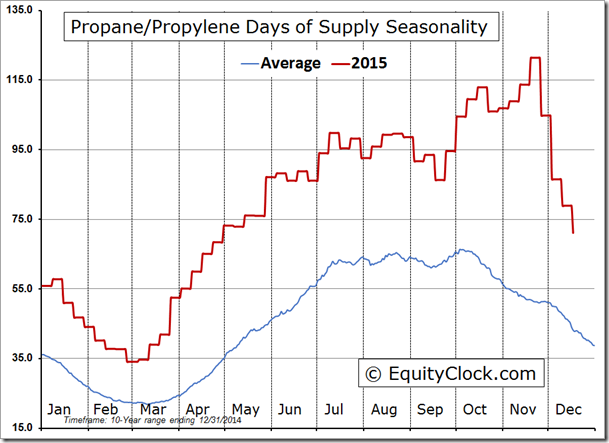
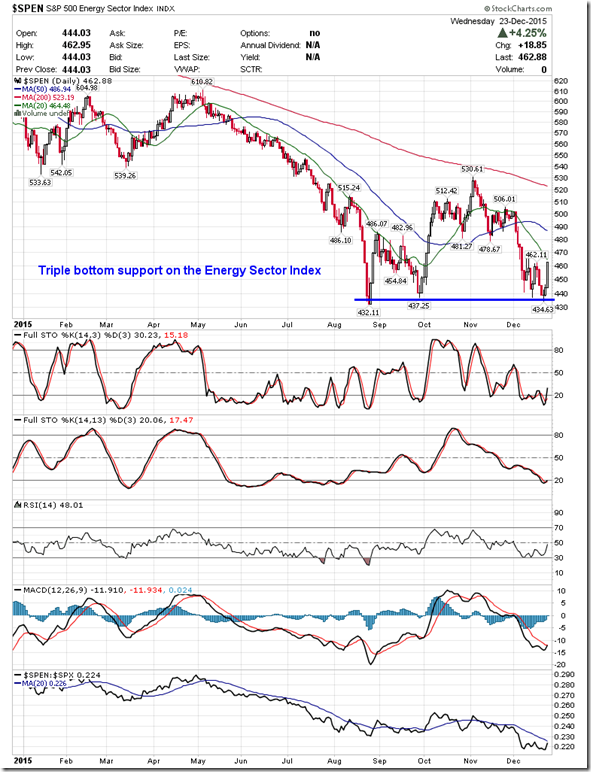
One of the catalysts fuelling the gains in the broader market on Wednesday was a rebound in the price of oil as the commodity and stocks continue to show positive correlation on an intraday basis. The energy sector was the best performing market segment on the day, gaining over 4% and rebounding from oversold levels. As highlighted in a previous report, the S&P 500 Energy sector index recently fulfilled the target of a head-and-shoulders topping pattern that was charted in October and November and now the sector benchmark is testing support around 440 for the third time since August. While short, intermediate, and long-term moving averages continue to point lower, investors may start to pick away at some names, speculating on a low in energy stocks. The move in oil and energy stocks was fuelled by a drawdown in oil inventories by 5.9 million barrels in the latest week. While the drawdown caught many analysts off guard, the decline in inventories falls inline with the seasonal tendencies for this time of year. The days of supply of the energy commodity has been declining since early November, now down to 29.1, following the typical seasonal tendency. However, the ending stocks of crude, remain relatively unchanged over the same timeframe, despite the tendency for drawdowns into yearend. The important period to watch will be the first few months of the new year when production typically outpaces demand. If the injection to inventories is more than current storage facilities can handle, the recent lows in the mid $30’s for WTI crude are unlikely to hold. For now, oil prices tend to rise through the end of the year, coinciding with the seasonal dip in inventories through the first couple of days of the new year.
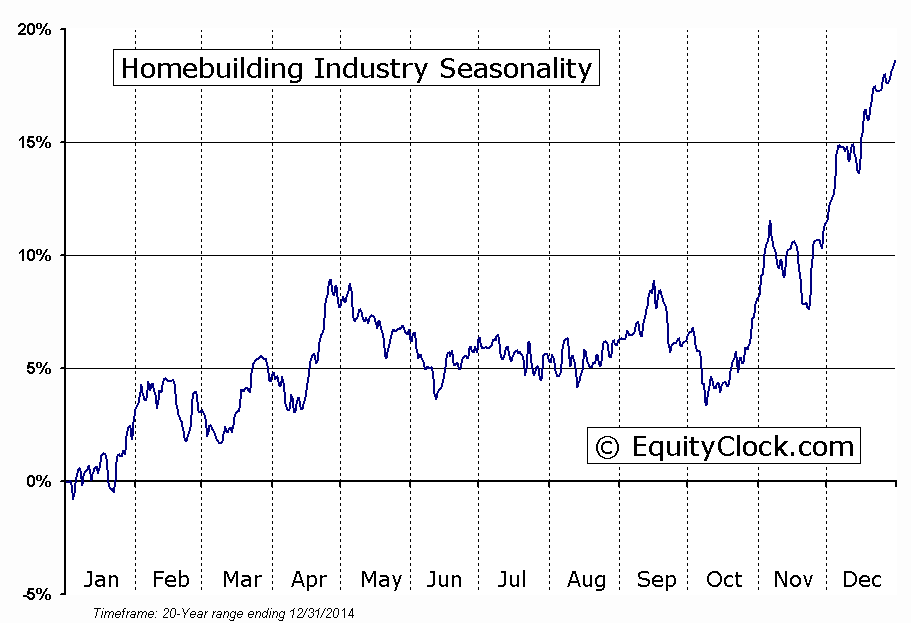
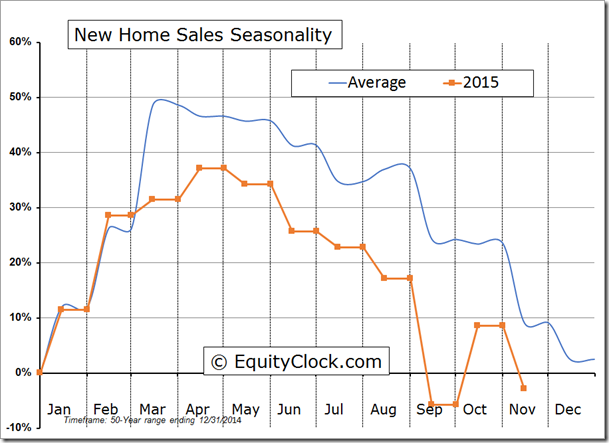
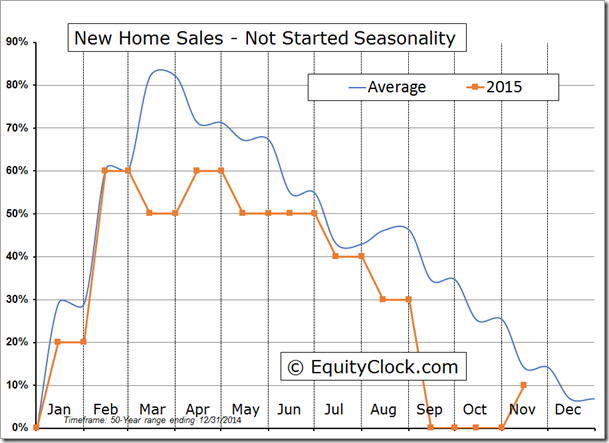
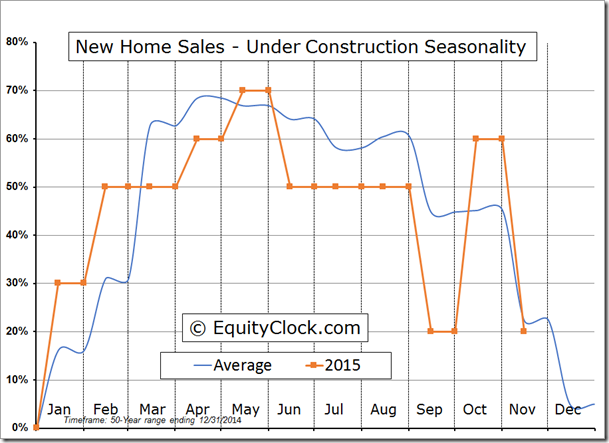
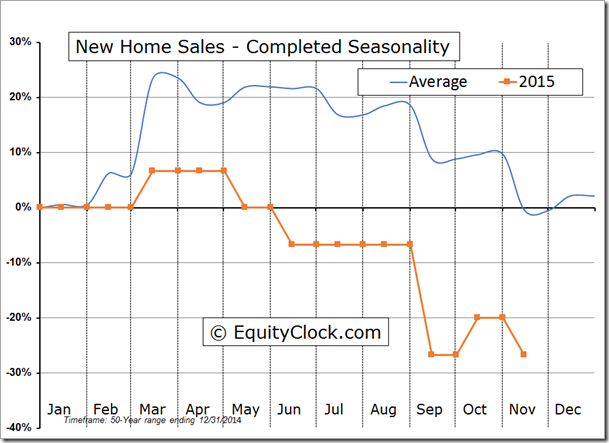
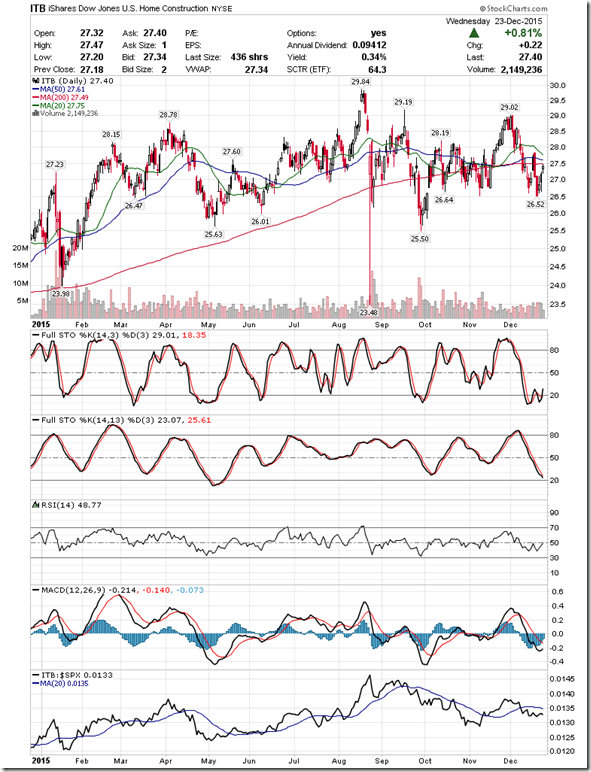
On the economic front, a report on New Home Sales and Durable Goods Orders gave something for investors to ponder over Christmas dinner. The headline print for New Home Sales indicated that sales increased by 4.3% in November to a seasonally adjusted annual rate of 490,000. Analysts had expected a rate of 503,000. Stripping out seasonal adjustments, sales were lower by 10.5%, which was slightly better than the average decline of 11.6% for the second to last month of the year. The year-to-date change in the sales of new homes has now dipped into negative territory for the year, continuing to run below the average trend. The US Home Construction ETF (N:ITB) closed higher by around eight-tenths of one percent, lagging the broader market move. Seasonally, December tends to be the strongest month of the year for stocks in this industry, gaining an average of 7.3% and trading positive 80% of the time, however, the present month-to-date loss of over 4% suggests the end of year bump may be a bust. The industry ETF has been underperforming the market since the end of November and resistance at the 200-day moving average is becoming apparent. The seasonal strength in the industry typically stretches into the middle of February as investors anticipate the spring rebound in home sales, but current struggles suggest that homebuilding stocks may be unable to achieve its typically positive result.

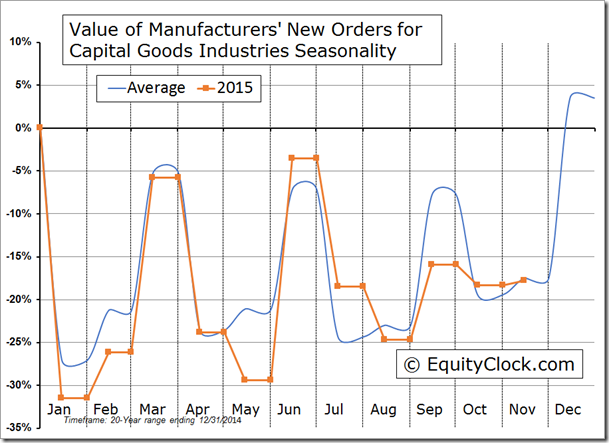
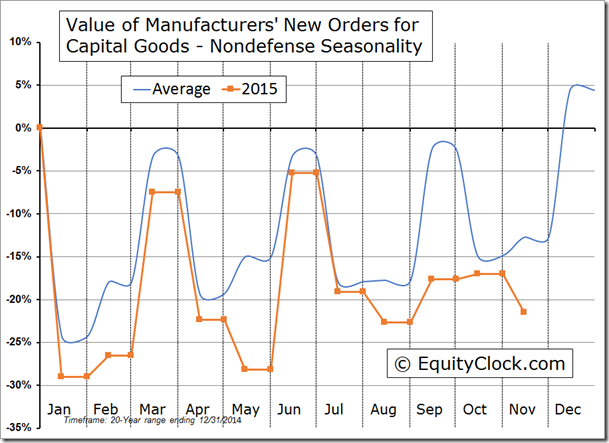
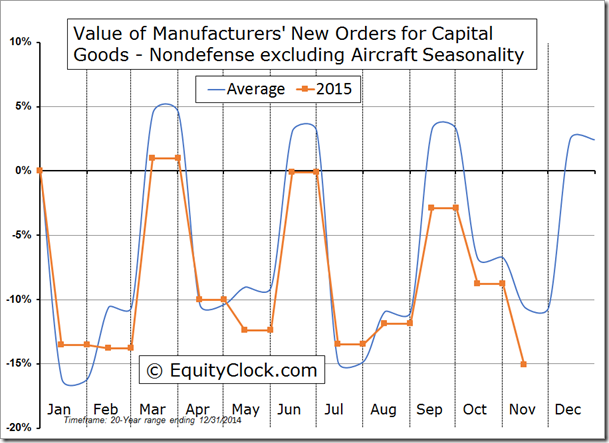
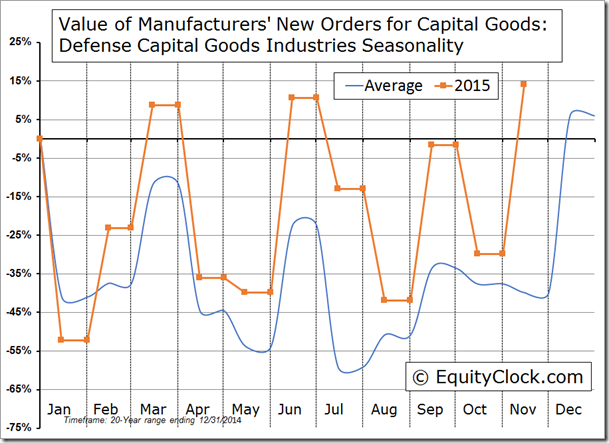
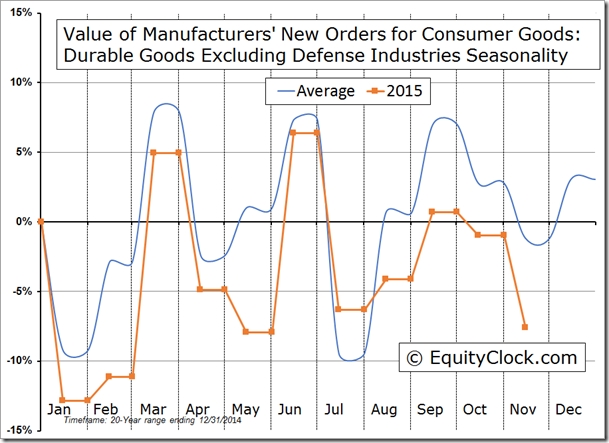
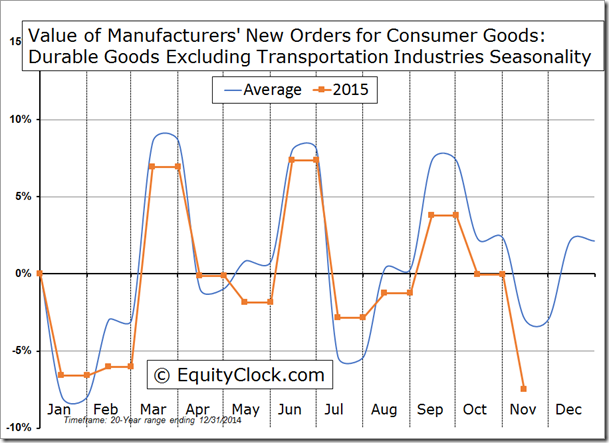
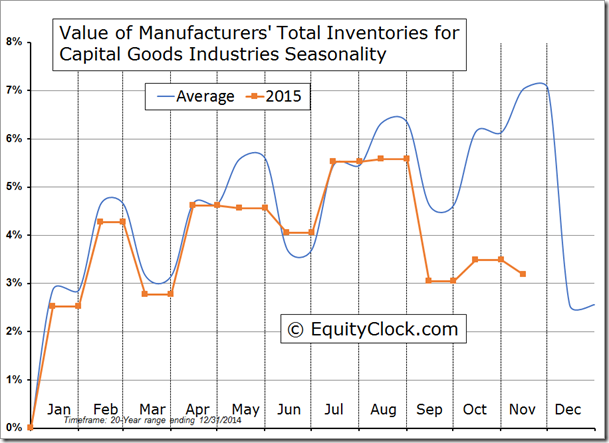
The other report released in the last full session before the Christmas break was Durable Goods Orders, and while the headline result was better than expected, the underlying components suggest a weakening trend. The headline print showed that new orders were unchanged (0.0%) last month, beating the consensus analyst estimate calling for a decline of 0.5%. Stripping out seasonal adjustments, the Value of Manufacturers’ New Orders for Capital Goods Industries gained 0.7% in November, which is less than half of the average gain of 2.1% for the second to last month of the year. The year-to-date trend is inline with the average with only one month left in the year. The trend across the components indicates that strength in defense spending is offsetting weakness in non-defense spending, highlighting the influence that geopolitical tensions is playing on this segment of the economy. The trend for new orders for Consumer Goods remains very weak, which is concerning going into the important end of year holidays. Inventories reported a rare decline in November of 0.3% as manufacturers keep tight controls over their stocks amidst sluggish demand, a trend has been evident since September. Seasonally, inventories plunge in the last month of the year, coinciding with strong December sales.
Sentiment on Wednesday, as gauged by the put-call ratio, ended bullish at 0.83.
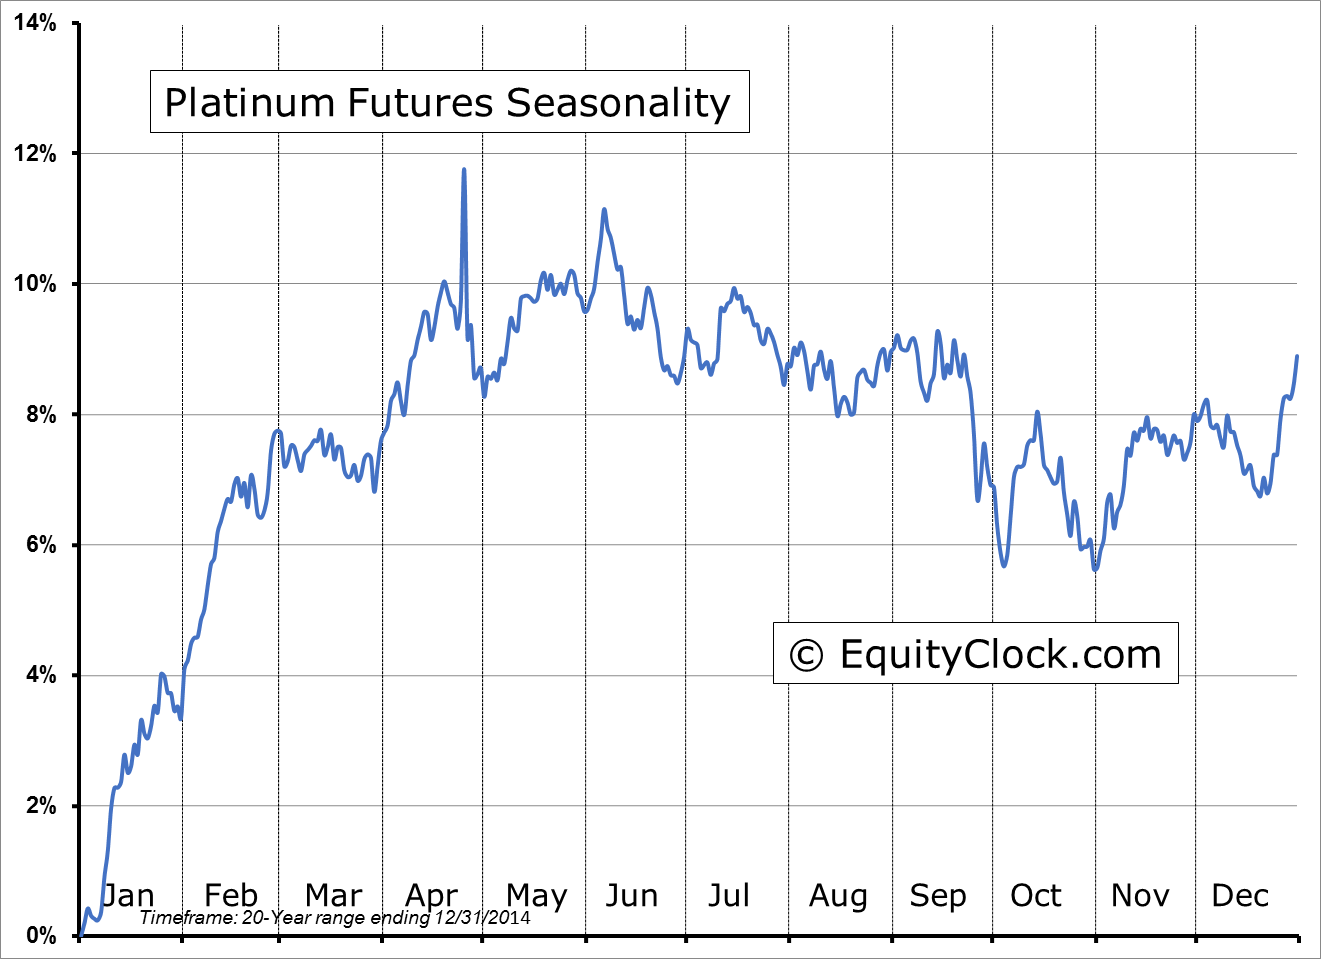
Sectors and Industries entering their period of seasonal strength:
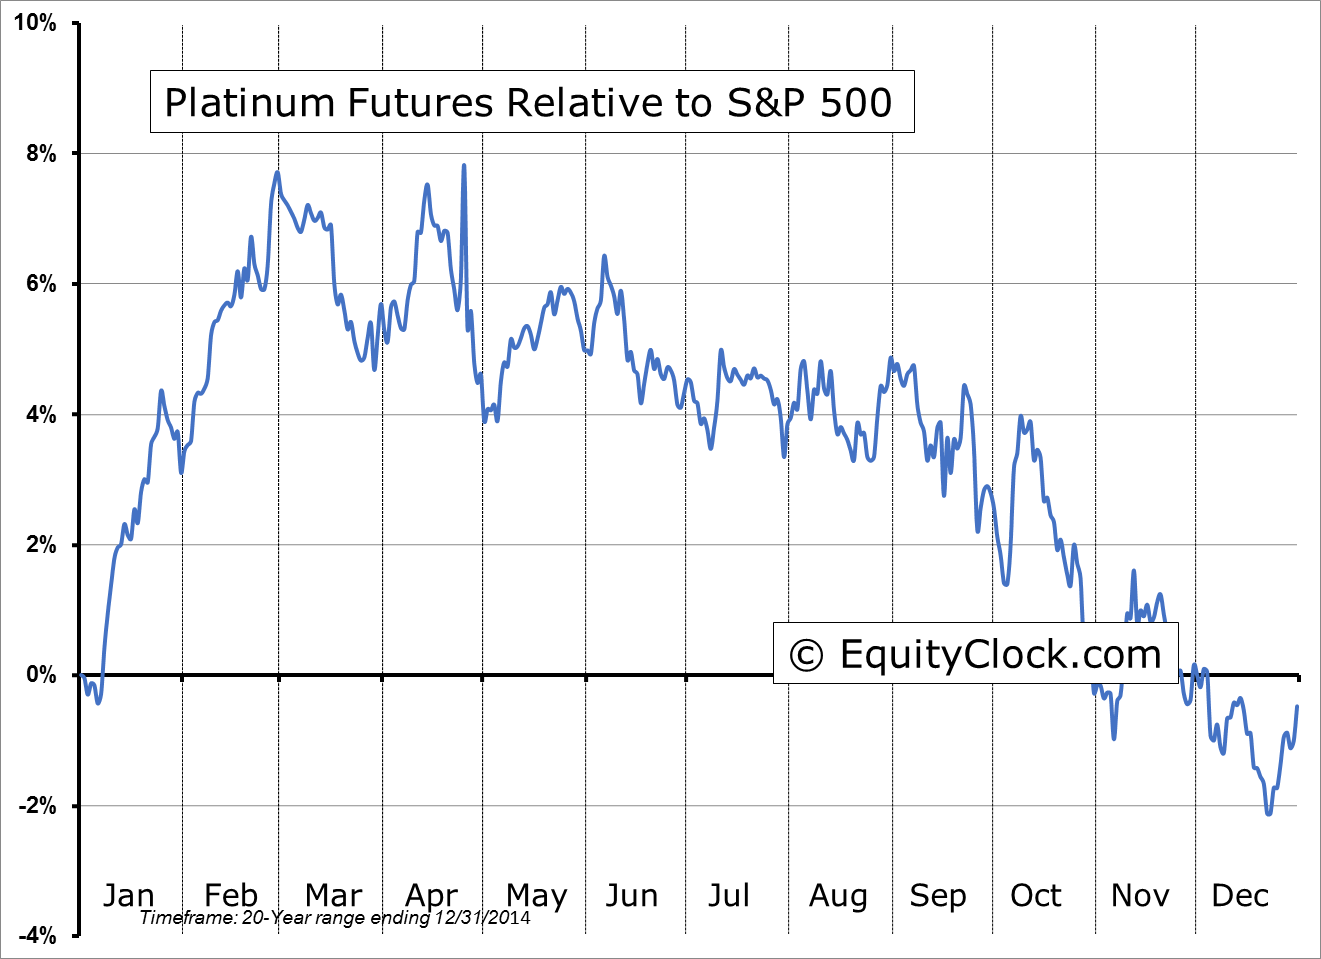
FUTURE_PL1 Relative to the S&P 500

Seasonal charts of companies reporting earnings today:
No significant reports expected today
S&P 500 Index
