Our regular participants share trading ideas, reflecting their contrasting styles and time horizons.
The Stock Exchange is all about trading. Each week, we do the following:
- Discuss an important issue for traders;
- Highlight several technical trading methods, including current ideas;
- Feature advice from top traders and writers; and
- Provide a few (minority) reactions from fundamental analysts.
We also have some fun. We welcome comments, links and ideas to help us improve this resource for traders. If you have some ideas, please join in!
Review: Are You Guilty of Risk Creep?
Our previous Stock Exchange asked: Are You Guilty of Risk Creep? We noted the market had been performing very well this year, and that’s when many investors forget that things can turn ugly quickly. No one can predict exactly when with 100% accuracy, but if you cannot handle a sell-off then now is a good time to stay disciplined and manage the amount of risk you’re taking in your portfolio so as to be consistent with your goals.
This Week: Models Gone Wild!
This week we consider what can happen when models go wild.
Of course we are talking about trading models. For example, in his book The Little Book that Beats the Market, Joel Greenblatt describes a magic formula trading model that:
“determines portfolio selections based on a combination of their relative cheapness and quality, as measured by earnings yield and return on capital. Formula Investing allows money to be managed in a disciplined manner that removes factors, like excess emotion and future projections, that often lead to bad investment results.”
Of course there are many different metrics upon which you can build a model. For example, some of the popular Russell indexes/benchmarks are just very basic models based on market capitalization and valuation metrics such as book value to price ratios.
And models can get much more complex, including machine learning, for example, as described here: Tools for Machine Learning Development by Jenn Webb at The Practical Quant.
There are also numerous examples of how NOT to build a model. For example, we wrote about the topic back in 2010 in The Hindenburg Omen, and included examples such as:
- Starting with the conclusion.
- Optimizing blindly.
- Using as many variables as needed.
On one hand, one of the big advantages of trading models is objectivity; they lack the emotional distractions that cause many humans to make mistakes. On the other hand, models lack supposed common sense. And this of course leads to the debate over whether traders should let the models do their thing without human interaction ever, or if humans should oversee the models so they don’t go wild. In fact, some people use trading models as nothing more than an idea generator, and then use their human experience to place manual trades based on suggestions from the models.
As we’ll discuss later in this report, we use our models as an objective idea generator, but Jeff oversees them and interjects common sense so they don’t run wild. The models hit challenging periods and less challenging periods as do all trading and investing strategies (for example growth has been beating the pants off value for the last 10 years–an unusual occurrence that many investors expect to eventually end badly for growth stocks). And while we use the models to objectively identify trading opportunities that we do implement implement selectively in concert with our other long-term fundamental investment strategies (for example “Great Stocks” and “Enhanced Yield), we don’t just let our models run wild.
Model Performance
We are sharing the performance of our proprietary trading models as our readers have requested.

Worth noting, our models increase and decrease their cash levels based on market conditions, so the performance in the table can appear more dramatic than reality, especially when considering the strategies are often combined with some of our longer-term strategies as well.
Expert Picks From The Models
Note: This week’s Stock Exchange report is being moderated by Blue Harbinger, a source for independent investment ideas.
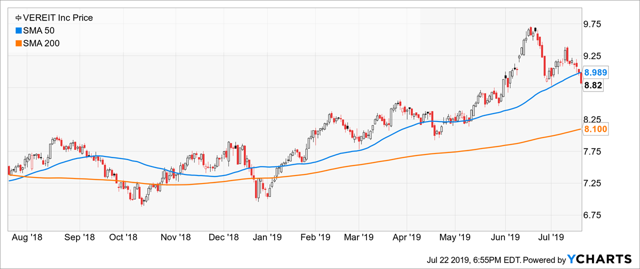
Holmes: This week I purchased shares of VEREIT (VER) on 7/17. How do you feel about that?
Blue Harbinger: Well I like a lot of REITs for their big yields, but VEREIT went ex-dividend at the end of June, and you’ll be out of the position before the next quarterly dividend arrives. Besides, why should I pay attention to your trades anyway, Holmes? Your track record isn’t exactly stellar over the last 12 months.
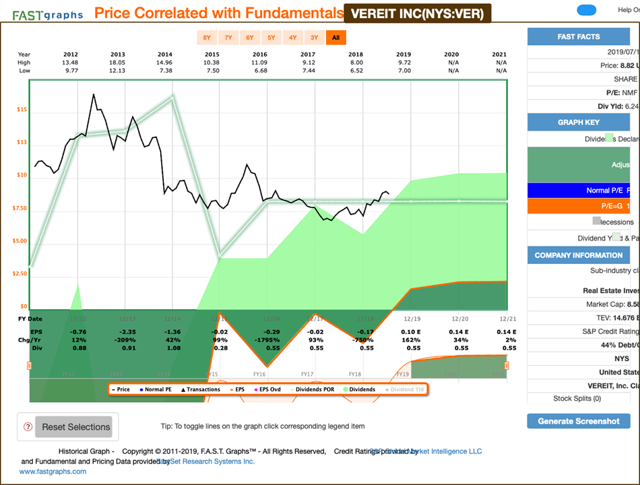
Holmes: I am a dip buyer (you can see the dip in the chart above), and I typically only hold for around 6 weeks. And I am a computer model, not a human, so my feeling aren’t hurt that you asked about my track record. My strategy has been back tested through many tens of thousands of historical trading periods, and I am not discouraged by a rough patch.
BH: Well I admire your data-driven back testing and your “sticktoitiveness.” Here is a look at some fundamental data in the following F.A.S.T. Graph if you change your “mind” and want to start paying attention to more fundamentals like Jeff when he actually manages investment accounts.
Athena: This week I bought Xerox (NYSE:XRX) (XRX) on 7/12. How do you feel about that trade?
BH: Xerox? Why’d you buy?
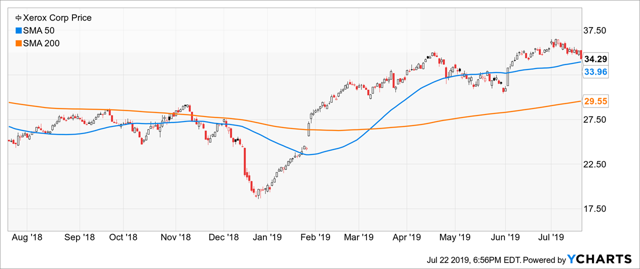
Athena: I look for stocks having strong positive trends and then select only those with the very strongest trends (“king of the hill”), constantly replacing the ones with weaker trends. It should not surprise anyone that I bought Xerox. A quick look at the chart should make the strength of the trend fairly obvious. And I generally continue to hold my positions until either the strength of the trend abates or a stock with an even higher trend strength comes along. I don’t have a set “holding period” for a position. I will exit only when either a stronger stock comes along or if market conditions dictate a strong potential for loss – capital preservation remains the key driver in all situations.
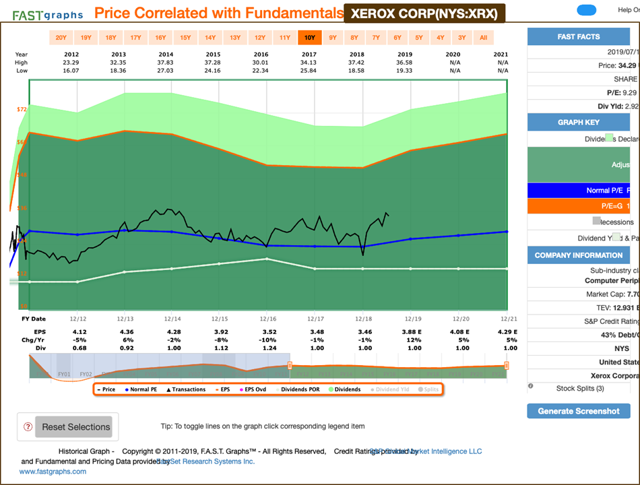
BH: Well Xerox is an old school blue chip in some investors’ minds, and the dividend yield at 2.9% isn’t horrible. Here is a look at the F.A.S.T. Graph.
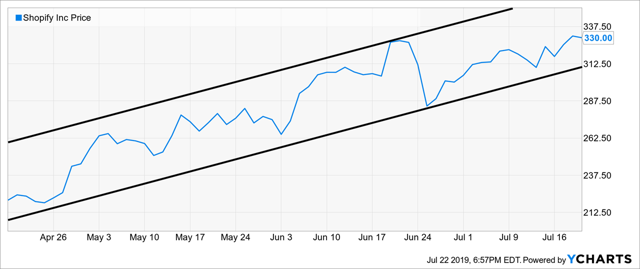
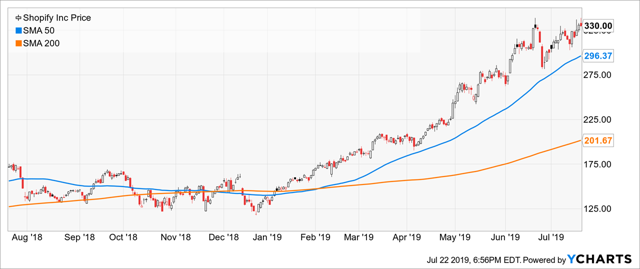
Roadrunner: I bought shares of Shopify (SHOP) on 7/12. As you know, I like to buy stocks in the lower end of a rising channel.
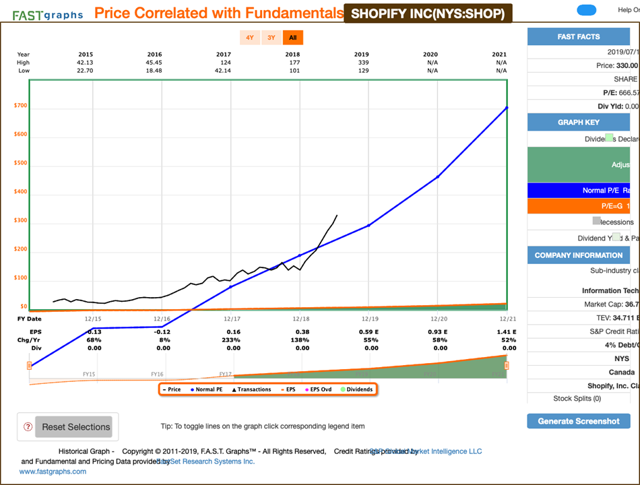
BH: Shopify has been on fire lately. You know there was an article by Tae Kim in the print edition of Barron’s a couple week’s ago describing it as an “Antidote to Amazon (NASDAQ:AMZN).” Here is a picture of the article:

Athena: Thanks for the information. I am not in it for the very long-term but that info still supports my thesis. Shopify’s returns have been truly amazing so far this year.
Conclusion
There are many different varieties and flavors of trading models, and just like humans–they have their strengths and weaknesses. Whether you are pro or anti trading models, and whether you believe trading models should be used in coordination with human intervention and oversight is up to you. We like to use our trading models only with human oversight and in coordination with our other longer-term fundamental investment programs, because left to their own devices, models can end up running wild. What are a few of your favorite trading model metrics, and how much human interaction do you allow into your trading programs?

