“Steady As She Goes” Stock Market (and Sentiment Results)…
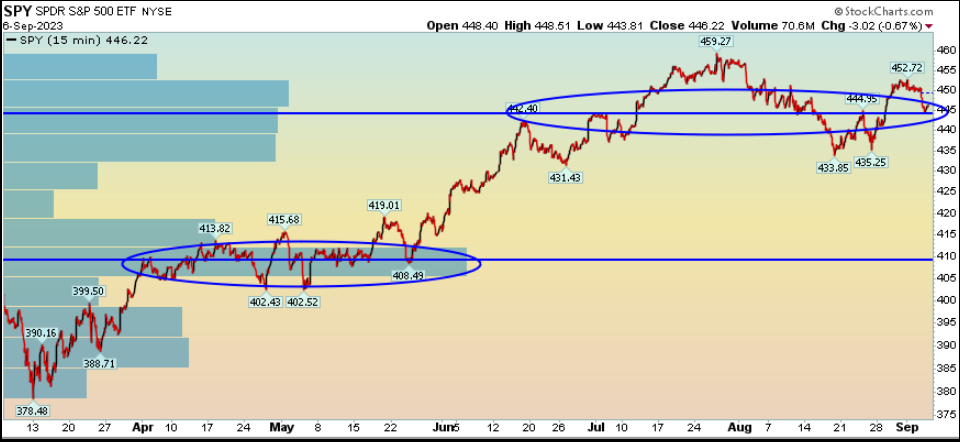
So what’s ailing the market? On August 18, there were big headlines that a “major manager” had just put a huge short on bonds – expecting yields to blow out. On our podcast|videocast that day we said that this particular hedge fund manager probably called the bottom in bonds and the top in rates by “shorting in the hole” one of the most crowded trades in history.
With the exception of one day, yields have stayed below the level when the “big announcement” was made. We anticipate that will persist and it has broad ranging implications – which we discussed in extensive detail on our three media appearances this week.
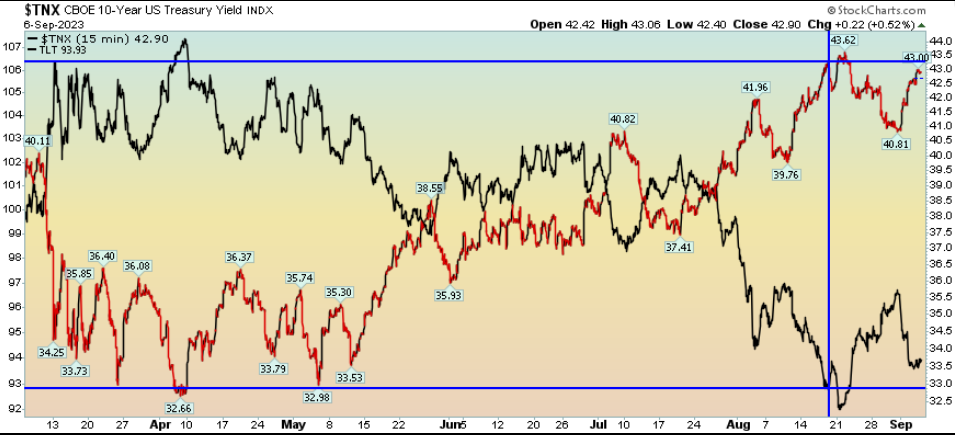
The blue horizontal line represents the day the headlines hit that the “major manager” announced his bond short. If you look at the black line – which represents TLT (20yr treasury ETF) – you’ll see that it was a near bottom tick. Perhaps this manager will turn out to be correct, but we’re going to take the other side of this crowded trade by burdening ourselves with the facts. The facts are that when everyone is thinking alike, they are probably not thinking:
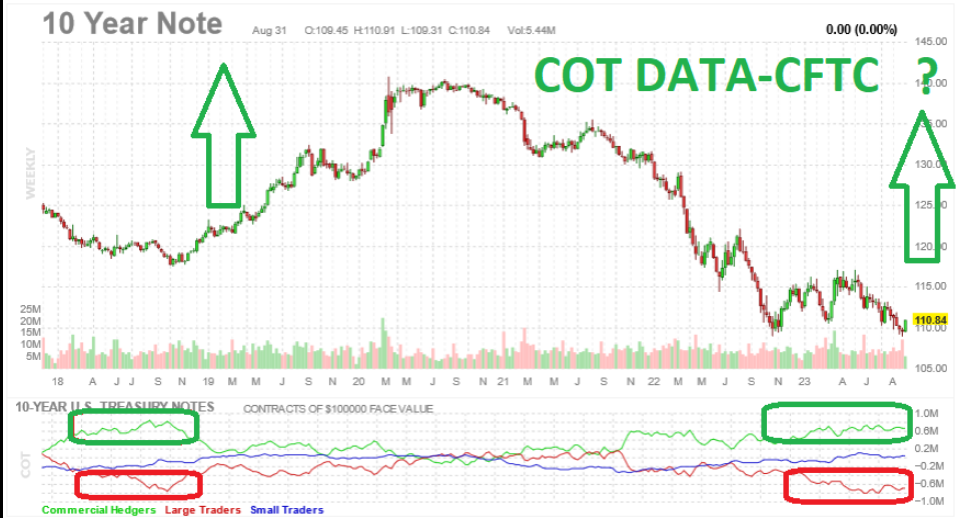
The red line represents the large traders/speculators/hedge fund managers who think they see something no one else does. The problem with this is the fact that EVERYONE is crowded short into the same trade – just like they were in 2018 before we had a monster rally in the 10yr (compression in yields). I do not expect that magnitude of a rally, but we are looking for the trend to reverse in coming weeks and months.
Fox Business
On Friday, I joined Charles Payne on Fox Business to discuss this very idea and how to benefit from it. The play is not to buy long bonds, but rather to buy those equities which have been beaten down the most due to the movement in yields – despite maintaining revenue, earnings power and cash generation. When the trend reverses in bonds, these equities will recover aggressively to intrinsic value. Thanks to Charles, Kayla Arestivo, Nick Palazzo and Haadya Khan for having me on the show:
Bloomberg HT (Turkey)
Earlier that morning I joined Ali Cinar to discuss the jobs report, the Fed and implications moving forward. We also covered emerging markets, earnings and China. Thanks to Ali for having me on:
Podcast Appearance
Yesterday I joined Patrick Weinert on his podcast to discuss in-depth our investing framework, the impact of demographics on our market outlook, and quite a number of our holdings. You can take advantage – even if you missed the live stream – by viewing here:
Update on 3M (NYSE:MMM)
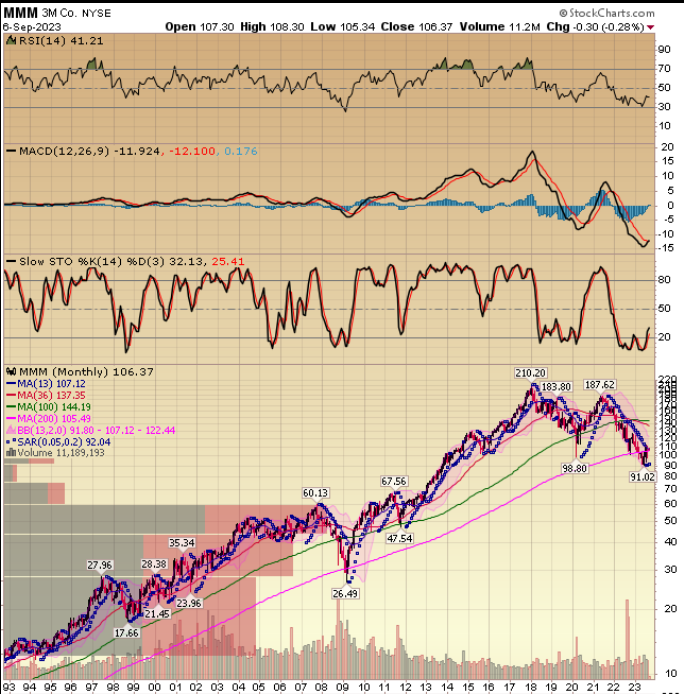
A few of the key catalysts have come to pass over the last few weeks and 3M is beginning to make its way higher.
General Market Indications
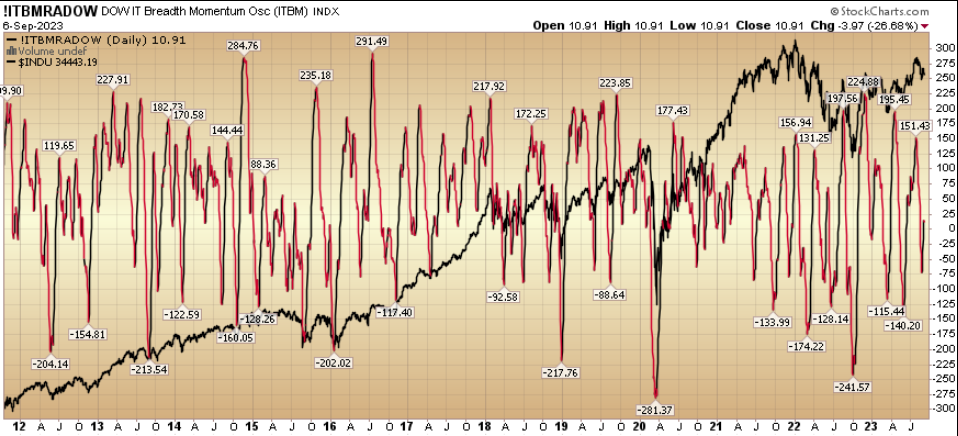
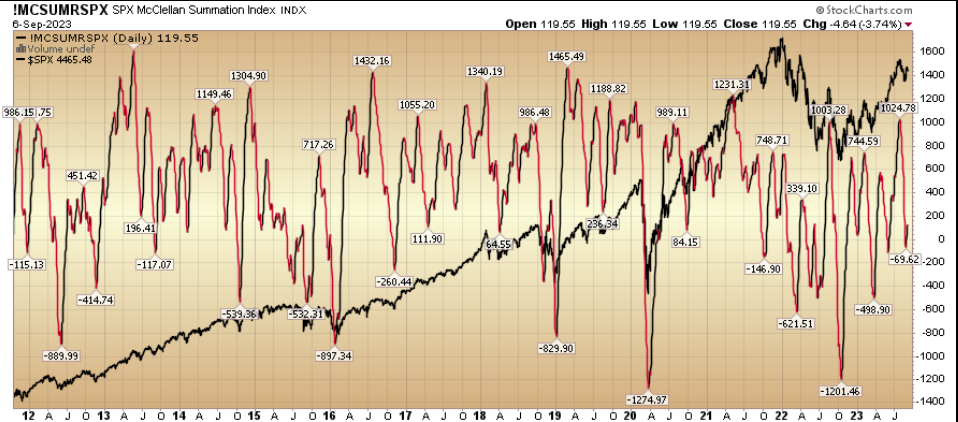
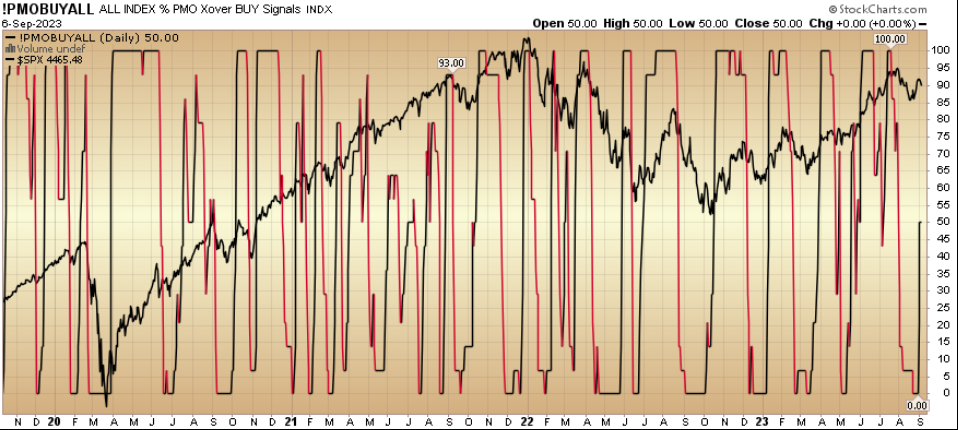
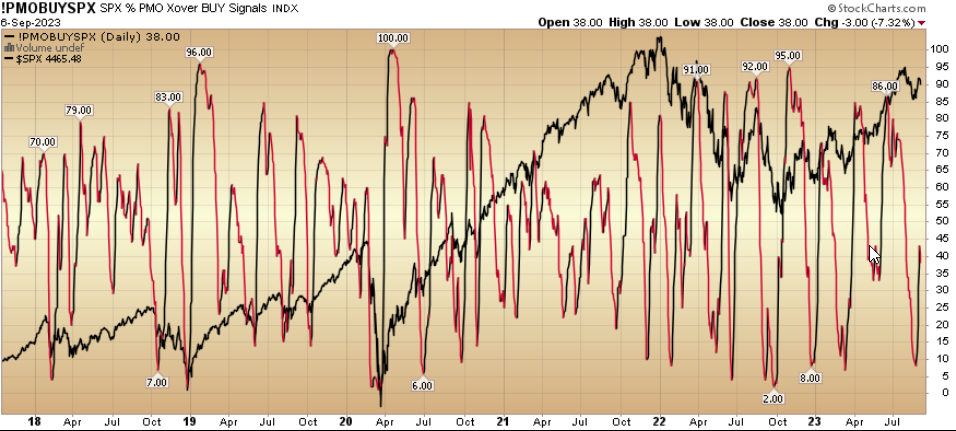
Our indicators do not imply a “TOP” at the moment. A number of them are more consistent with a “bottom(ing)” or mid-recovery:
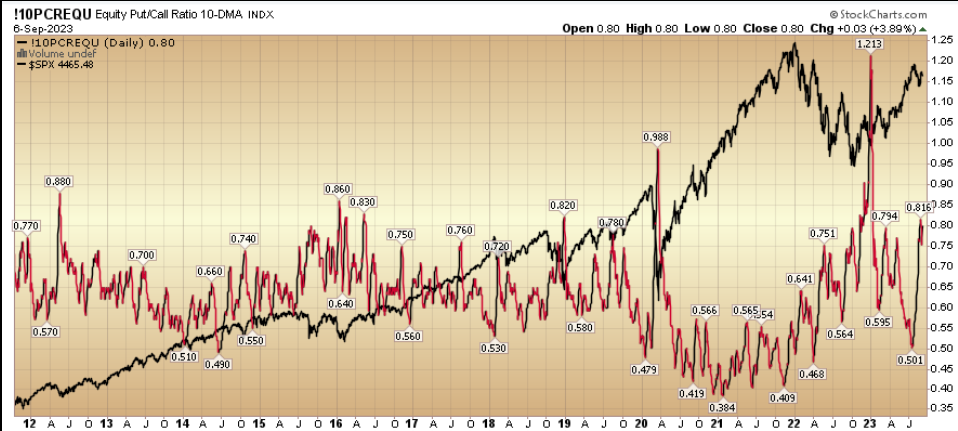
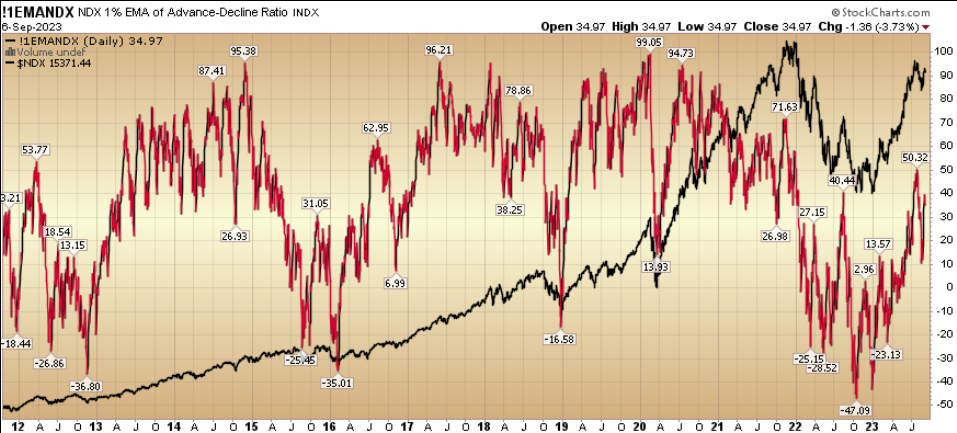
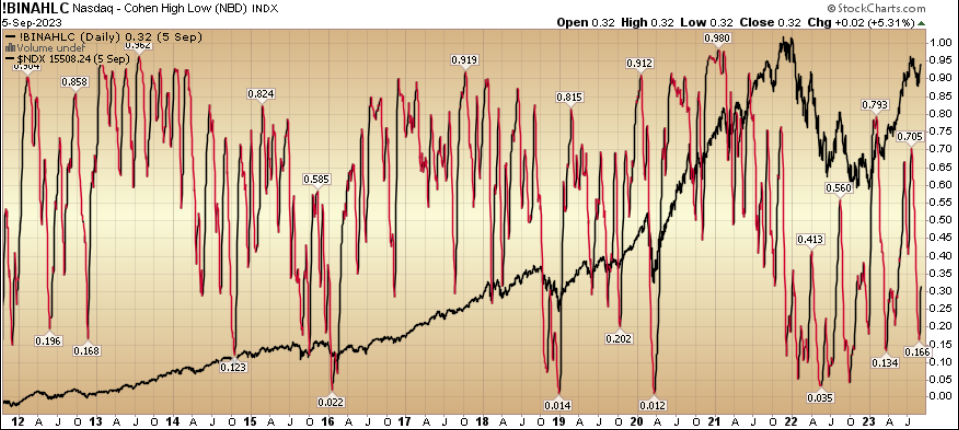
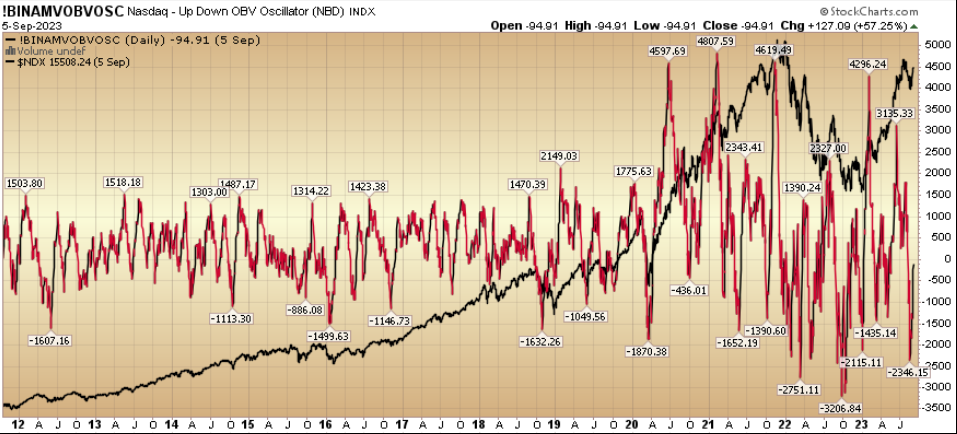

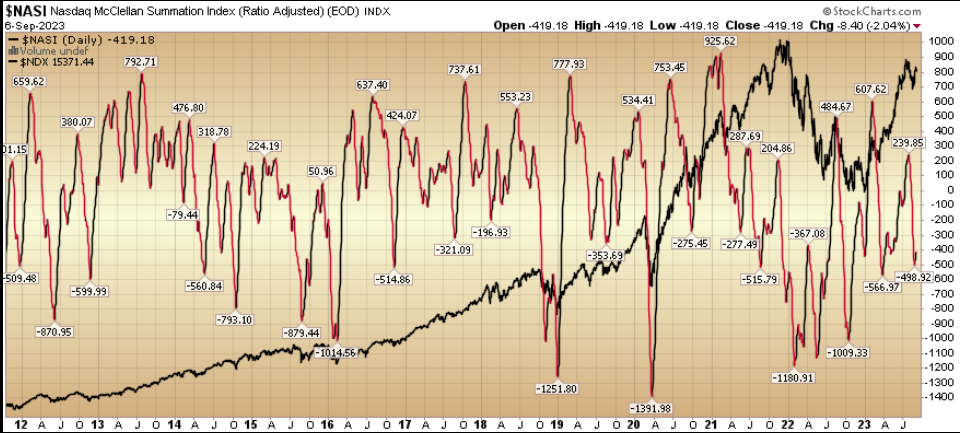
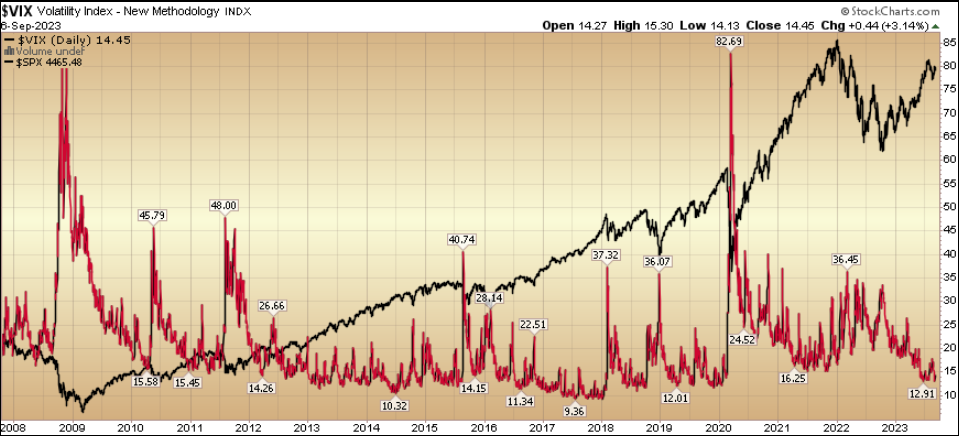
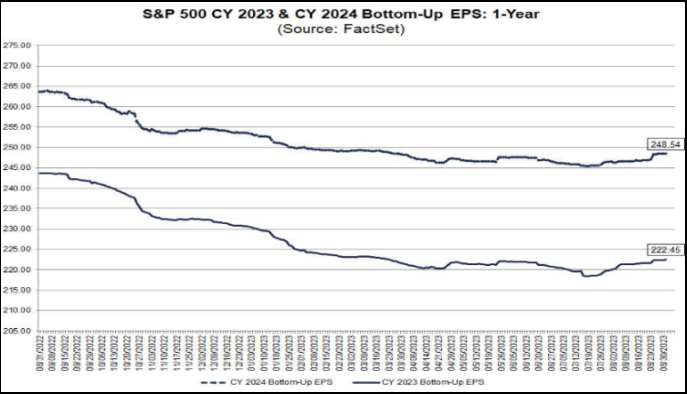
Now onto the shorter term view for the General Market:
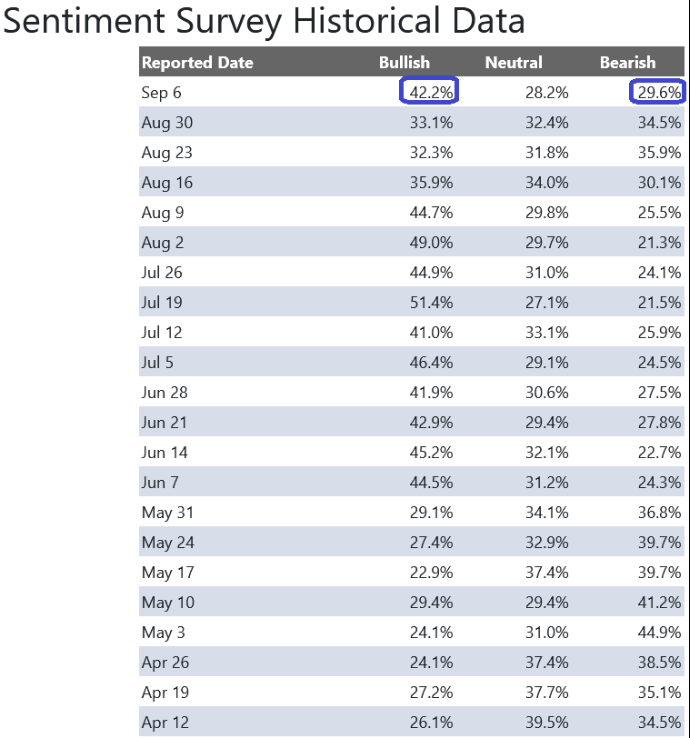
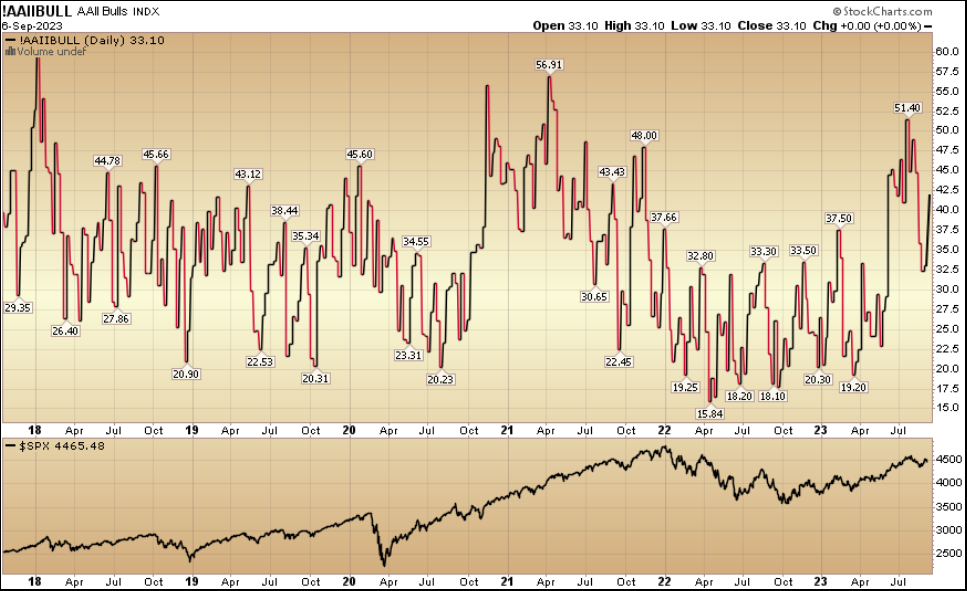
In this week’s AAII Sentiment Survey result, Bullish Percent (Video Explanation) jumped up to 42.2% from 33.1% the previous week. Bearish Percent dropped down to 29.6% from 34.5%. The retail investor is showing renewed optimism.
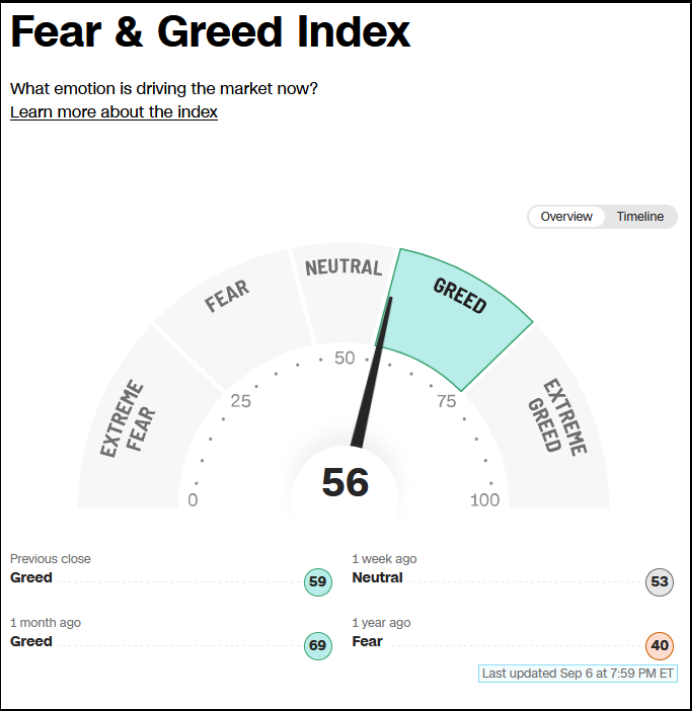
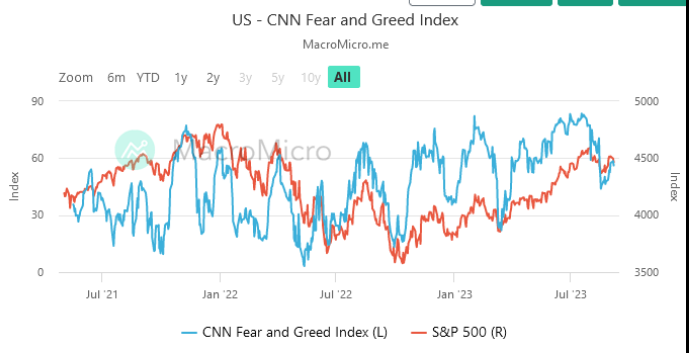
The CNN “Fear and Greed” ticked up from 51 last week to 56 this week. You can learn how this indicator is calculated and how it works here: (Video Explanation)
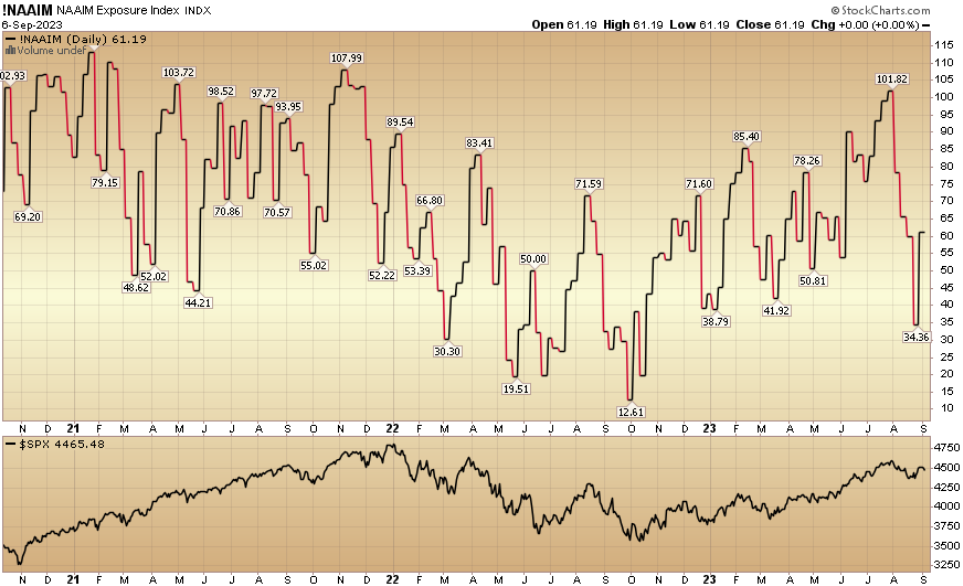
And finally, the NAAIM (National Association of Active Investment Managers Index) (Video Explanation) jumped to 61.19% this week from 34.36% equity exposure last week. Guess (NYSE:GES) who sold in the hole and is having to “chase up” yet again?
This content was originally published on Hedgefundtips.com.
