Last week, the S&P 500 (ESZ17:CME) gapped open Sunday night at 2467.75, made a low four ticks below the open, then rallied up to 2495.50 on Wednesday’s Globex open before trading sideways for much of the next three sessions, maintaining a ten handle range from Wednesday into much of Friday’s session.
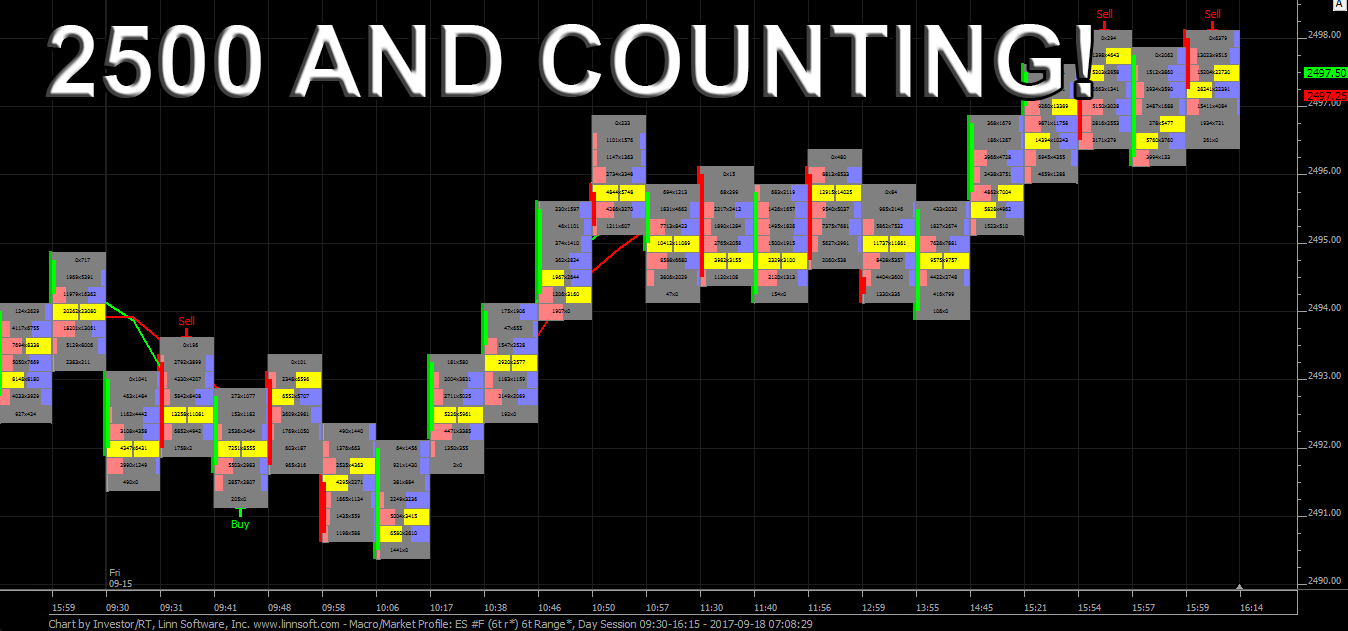
After selling off down to 2487.00 on Friday, due to the missile fire across Japan from North Korea, the futures recovered most of that going into the 8:30 am cst regular session. On the open, the ES printed 2491.75, down 3.00 handles, and pushed up to 2493.25 on the open before dropping to the cash session low of 2490.50 just after 9:00am CT.
When that low was found, the S&P’s began to see some large buy imbalances and push up to 2496.75, unchanged on the day, going into the 10:00 hour. After a pullback to 2494.00 at 12:30pm CT, the index futures prepared for the afternoon NHOTC late day Friday rip as the ES made its way up to a new all time high of 2498.00, before settling the 3:15 cash close at 2497.25, up two ticks.
However, after the futures re-opened at 3:30, new buying was able to push the benchmark futures up to 2500.00, where it then closed on the day and week. The quad witch expiration week opened with buying, then looked like a dud into Friday’s close, but finally made the key psychological 2500 print after trading completely within the 2400 handle for 79 sessions. It was early March 2008, now 9.5 years ago, when we watched the S&P 500 make its 666 low, and now a decade later its trading at 2500.
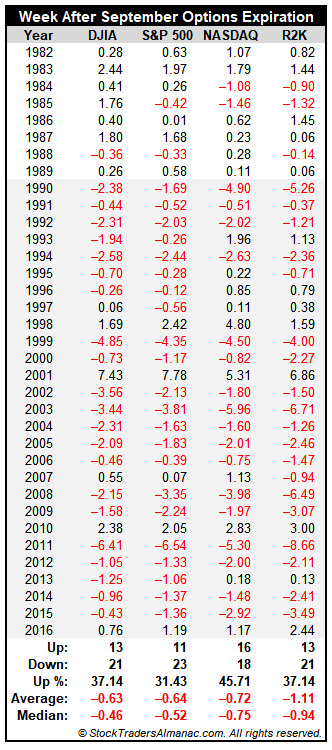
S&P 500 down 22 of last 27 week after September options expiration, average loss 1.00%
From the Stock Trader’s Almanac:
This week is the week after September options expiration week and it has a dreadful history of declines particularly since 1990. This week has been a nearly constant source of pain with only a few meaningful exceptions over the past 27 years (shaded in grey). Substantial and across the board gains have occurred just four times: 1998, 2002, 2010 and 2016 while many more weeks were hit with sizable losses.

Since 1990, average weekly losses are even worse; DJIA –1.07%, S&P 500 –1.00%, NASDAQ –0.98% and a stout –1.50% for Russell 2000. End-of-Q3 portfolio restructuring is the most likely explanation for this trend as managers trim summer losers and reposition portfolios for the upcoming fourth quarter.
While You Were Sleeping

Overnight, equity markets in Asia and Europe followed through on Friday’s strength, and traded higher across the board.
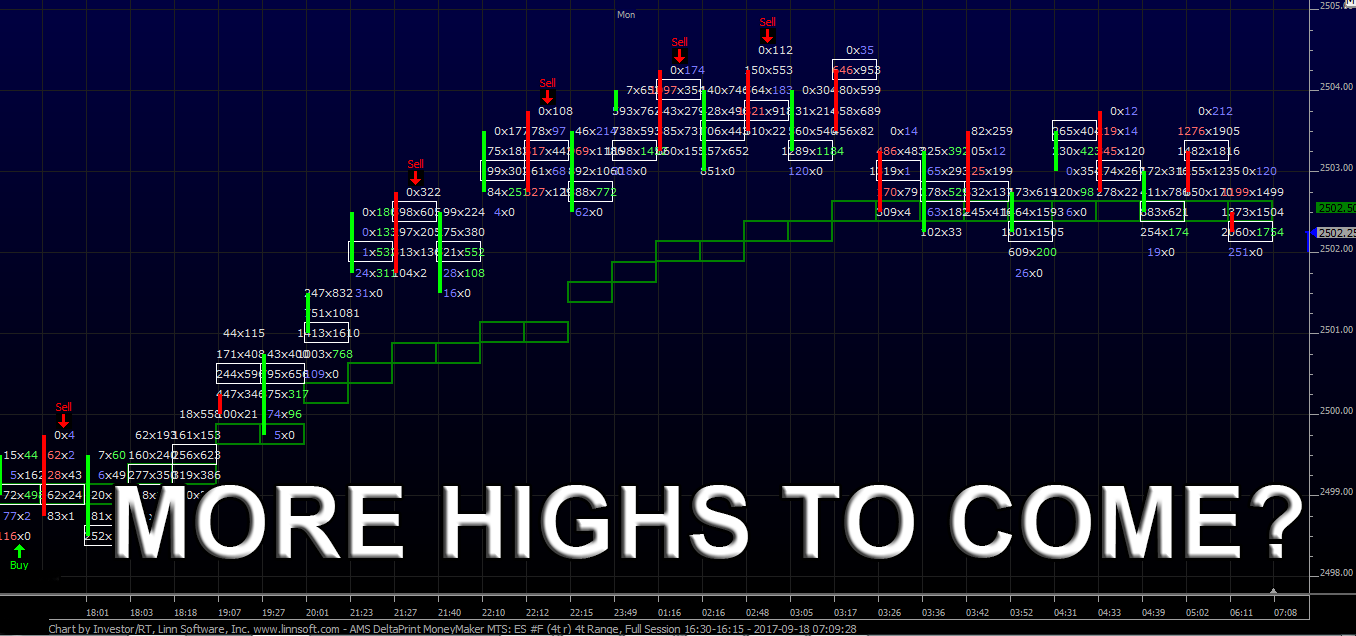
In the U.S., the S&P 500 futures opened last nights globex session at 2499.00, and immediately printed the overnight low at 2498.50. From there, the ES slowly made its way higher, and printed a high at 2504.50 just before 2:30am CT, and extending the range to 6 handles. As of 7:10am CT, the last print in the ES is 2502.00, up 4.75 handles, with 115k contracts trading.
In Asia, 9 out of 11 markets closed higher (Shanghai +0.29%), and in Europe 12 out of 12 markets are trading higher this morning (FTSE +0.42%).
Today’s economic includes the Housing Market Index at 10:00 a.m. ET.
Our View
Another Globex rally up to 2504.50 before some weakness after the European open. It’s hard to be a buyer here above 2500, but it’s equally hard to be a seller. The post expiration stats are noticeably weak, as historically September starts to really fall off a cliff after the mid month rebalance.
While I have always been aware of these stats, and found them solid to lean on at time, this market is different. Last year, any seasonal weakness was very light, and mostly due to the election, after some pullbacks the S&P saw the largest monthly rally ever, in October.
We think there does need to be some back and fill around the 2500 level. It seems like when the S&P has hit the new big round levels that it usually will take multiple weeks before it can finally build a floor there.
However, you will not catch us trying to find a top to short. Instead we look to buy weakness, a ten handle pullback would be 2494.50, which is just below where most of last week’s ceiling was. We see support at 2489-90 and 2494-96.
PitBull: CLX osc 21/6 turns down on a close below 50.31; ESZ osc 29/14 turns up on a close above 2506.85; VIX osc -13/-7 turns up on a close above 10.86.

- In Asia 9 out of 11 markets closed higher: Shanghai Comp +0.29%, Hang Seng +1.27%, Nikkei +0.52%
- In Europe 12 out of 12 markets are trading higher: CAC +0.24%, DAX +0.25%, FTSE +0.42%
- Fair Value: S&P -2.33, NASDAQ +5.97, Dow -44.45
- Total Volume: 1.3mil ESZ & 600 SPZ traded in the pit
