
S&P Emini pre-open market analysisEmini daily chart
- o The S&P 500 Futures gapped down and sold off yesterday after testing near the December 28th high. The bulls are disappointed after the recent three-day rally.
- o The selloff yesterday is a reminder that the daily chart is still in a trading range from late December.
- o The bulls still have the magnet of the March 2022 high and they will probably reach it soon.
- o The bears have done a good job halting the buying. However, it is not enough. The odds still slightly favor trend resumption. The bears need to start getting more closes below the moving average if they are going to get a successful major reversal of the bull rally.
- o Overall, traders should expect more sideways to continue up trading.
Emini 5-minute chart and what to expect today
- o Emini is up 16 points in the overnight Globex session.
- o The Emini is getting an upside breakout, just before the opening session.
- o As always, traders should assume that the market will go sideways on the open. This means that most traders should consider not trading for the first 6-12 bars unless they are trading with limit orders and are quick to make decisions.
- o Most traders should try and catch the opening swing that often begins before the end of the second hour. It is common for the market to form a double top/bottom or a wedge top/bottom before the opening swing begins.
- o Today is Friday, so weekly support and resistance are essential. The bulls have a strong bull close so far on the week. They are hopeful that today will rally, causing the weekly chart to close near its high.
- o Traders should be mindful that Friday often gets surprise breakouts late in the day, as traders decide on the close of the weekly chart.
Yesterday’s Emini setups
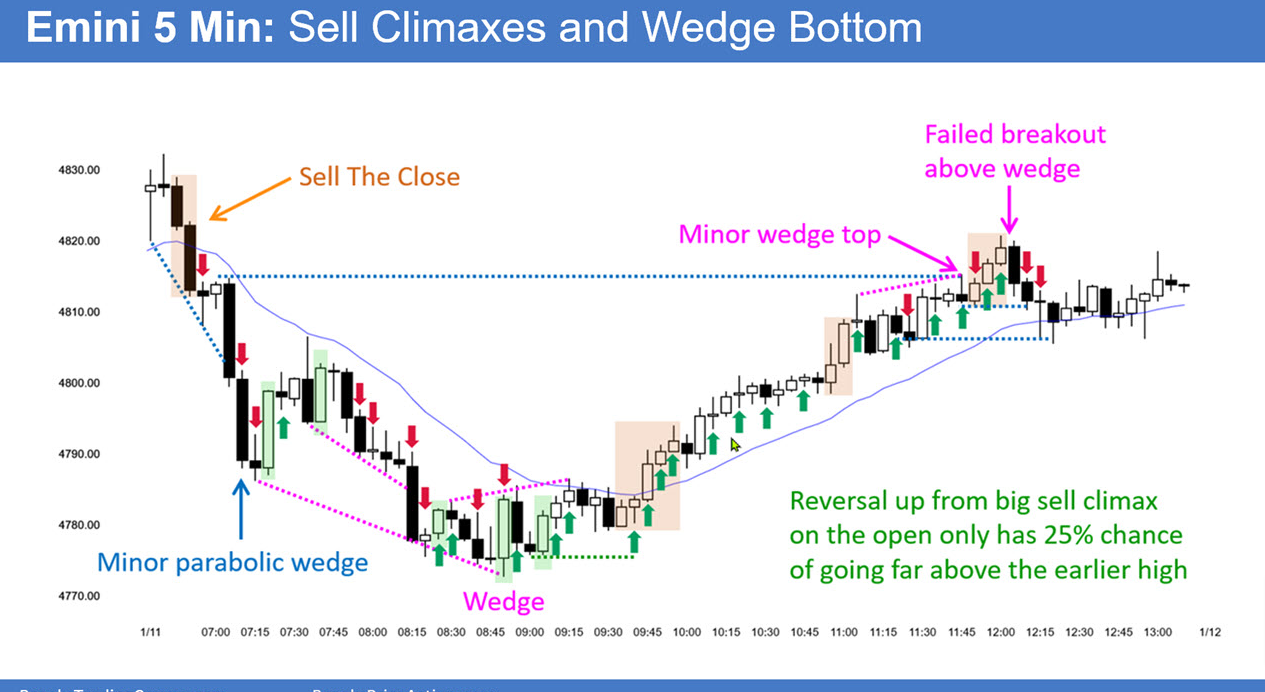
Here are reasonable stop entry setups from yesterday. I show each buy entry bar with a green arrow and each sell entry bar with a red arrow. Buyers of both the Brooks Trading Course and Encyclopedia of Chart Patterns have access to a near 4-year library of more detailed explanations of swing trade setups (see Online Course/BTC Daily Setups). Encyclopedia members get current daily charts added to Encyclopedia.
My goal with these charts is to present an Always In perspective. If a trader was trying to be Always In or nearly Always In a position all day, and he was not currently in the market, these entries would be logical times for him to enter. These therefore are swing entries.
It is important to understand that most swing setups do not lead to swing trades. As soon as traders are disappointed, many exit. Those who exit prefer to get out with a small profit (scalp), but often have to exit with a small loss.
If the risk is too big for your account, you should wait for trades with less risk or trade an alternative market like the Micro Emini.