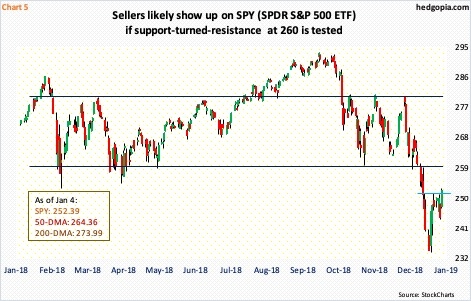
Fundamentals are still a suspect, but US stocks were treated with soothing comments from Fed chief last week. Bulls have the ball, but bears are likely to show up at $260 on SPDR S&P 500 (NYSE:SPY).
Speaking at the American Economic Association’s annual meeting last Friday, Jerome Powell, Fed chair, said he is “listening sensitively to the message that markets are sending,” about downside risks to the economy, adding “we will be prepared to adjust policy quickly”.
It took a decent selloff in US stocks for a change in his tone. In recent weeks, several other FOMC members – both voting and non-voting – have expressed similar dovish sentiment. Powell also said the Fed would not hesitate to use – again – the balance sheet as a tool, if the need be.
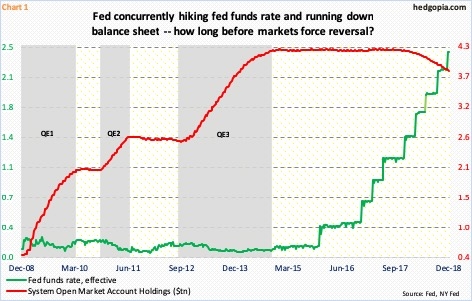
Post-financial crisis of a decade ago, the Fed launched quantitative easing (QE) three times. System Open Market Account (SOMA) holdings went from under $500 billion in December 2008 to $4.24 trillion in April 2017. In October that year, it began to run down its balance sheet. As of last Wednesday, SOMA holdings stood at $3.84 trillion (Chart 1). Major US equity indices did rise to new highs last year, but only to then come under pressure. The S&P 500 large cap index (2531.94) peaked at 2940.91 on September 21. By December 26, it dropped to 2346.58. In 2018, it fell 6.2 percent – the first annual drop since 2008.
Noticeably, Powell’s dovish comments came in the same day that December’s employment report showed the economy produced much-stronger-than-expected 312,000 nonfarm jobs. In all of 2018, 2.6 million jobs were created, for a monthly average of 220,000 jobs – the highest monthly average since 2015. The unemployment rate in the last six months came in sub-four percent. The jobs picture is robust.
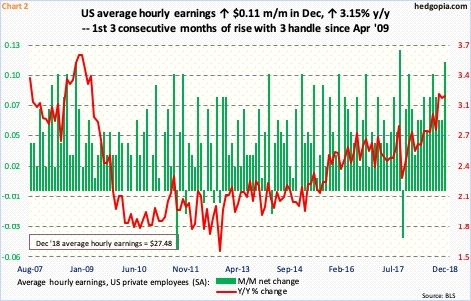
Wage growth has not quite shown the same momentum but has picked up speed in recent months. In December, average hourly earnings of private-sector employees rose $0.11 month-over-month to $27.48. Year-over-year, they were up 3.15 percent. This was the third consecutive monthly increase of three-plus percent. The last time wages grew with a three handle was in April 2009 (Chart 2). This is “quite welcome…for me at this time does not raise concerns about too high inflation,” Powell said.
The dovish shift provided solace to investors who have otherwise been taken aback by sudden deceleration in several other data points – both here and abroad. From weakness in South Korean exports to Chinese manufacturing, the global economy seems to have meaningfully downshifted in December.
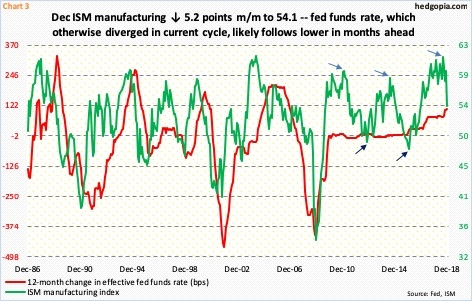
Domestically, the ISM manufacturing index fell 5.2 points month-over-month in December to 54.1, which was the lowest since November 2016. The m/m drop was the widest since October 2008. A collapse in new orders was the main culprit. Orders declined 11 points m/m to 51.1. As recently as last August, the main index was at 61.3, which was the highest since May 2004. It is hard to sustain above 60. The softness comes amidst a tightening campaign by the Fed.
In the wake of the financial crisis, the fed funds rate got pushed to the floor and was left there for seven long years until the Fed began raising in December 2015. Rates have since gone up nine times in 25-basis-point increments to a range of 225 to 250 basis points. During all this, manufacturing went through its usual ups and downs – marked by arrows in Chart 3 – but the red line maintained a slightly upward bias. But it is possible it is about to follow the green line lower. Powell suggested as much last week. This is what equities are beginning to price in post-Christmas.
Since the aforementioned low on December 26, the S&P 500 has rallied 7.9 percent. During the October-December rout, several indicators got pushed into oversold territory, some of them to panicky levels. Unwinding of these conditions can continue near term. Fundamentally, the 4Q18 earnings season begins in earnest next week, and bulls hope they help more than hurt.
Apple's (NASDAQ:AAPL) December-quarter warning last Wednesday came out of left field. More similar surprises may lie ahead as the reporting season progresses. With that said, the bar is low – or lower than just a few months ago.
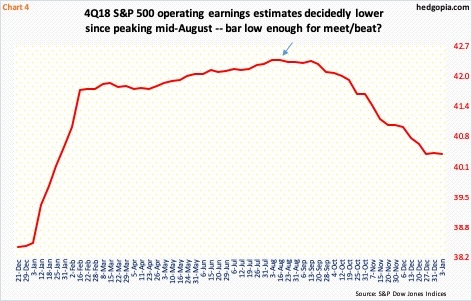
As of last Thursday, 4Q18 estimates were $40.39, which is higher than $38.41 on December 21, 2017. The Tax Cuts and Jobs Act of 2017 was signed into law on December 22 that year. Post-tax cuts, estimates rose, peaking at $42.40 mid-August last year (arrow in Chart 4). Since that high, as 4Q drew near, the sell-side bas revised estimates downward by nearly five percent.
Stocks took a nice beating into the reporting season, with signs of stability of late. As a matter of fact, twice in the past seven sessions on the NYSE – December 26 and January 4 – up volume made up 95 to 96 percent. This is quite rare, and more often than not can amount to a decent bottoming process medium term. Time will tell.
Near term, during the three-month selloff, one after another support gave way. SPY is no exception. For months, the ETF ($252.39) played ping pong between $280 and $260. The latter was lost mid-December (Chart 5). Immediately ahead, this can act as a magnet.
A convincing rally past $260 has the potential to take out stops and feed on itself, at least for the time being. In this scenario, there is no shortage of dry powder out there.
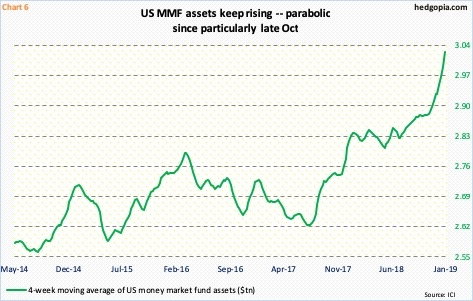
Last week, US money-market-fund assets remained north of $3 trillion for four consecutive weeks. On a four-week moving average basis, these assets were $3.02 trillion as of last Wednesday. The green line in Chart 6 has steadfastly risen since last July, and most noticeably since late October when it went parabolic. It will be interesting to see if last Friday’s massive rally in major indices was helped by outflows from these funds, which is what bulls would like, and need, to see. A lack thereof is not very encouraging. We will find out in the middle of next week.
For now, bulls do have the ball, although SPY has already rallied nicely off the lows. One way to play this is through options. Hypothetically, January 25th SPY 248 put sells at $3. If put, it is a long at $245. If it goes toward the aforementioned $260, the short put can possibly be turned into a strangle or an iron condor.
Thanks for reading!

