
Snap-on Incorporated (NYSE:SNA) has reported adjusted earnings of $3.03 per share in fourth-quarter 2018, in line with the Zacks Consensus Estimate of $3.03 and up 12.6% from the year-ago quarter.
On a GAAP basis, the company posted earnings of $3.09, which increased 37.9% on a year-over-year basis. The bottom line benefited from Snap-on’s robust business model and focus on value-creation processes. Higher sales owing to gains from acquisitions, broad-based strength in Commercial & Industrial Group division and increased sales in the U.S. franchise operations further boosted Snap-on’s bottom-line performance.
Snap-On Incorporated Price, Consensus and EPS Surprise

Snap-On Incorporated Price, Consensus and EPS Surprise | Snap-On Incorporated Quote
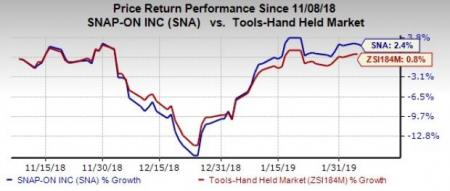
In the last three months, shares of this Zacks Rank #3 (Hold) company gained 2.4%, outperforming the industry’s 0.8% growth.
Q4 in Detail
Net sales dropped 2.3% to $952.5 million and lagged the Zacks Consensus Estimate of $963.2 million. The downside can be attributed to adverse impacts of currency translations and organic sales decline of 0.6%, somewhat offset by gains from acquisitions.
Segment wise, sales for Commercial & Industrial Group improved 0.6% to $343.7 million. Organic sales were up 3.5%. Increased sales to critical industries, higher sales in the segment’s Asia Pacific operations and specialty tools business, and rise in sales at Europe-based hand tools business drove the upside. This was somewhat marred by currency headwinds.
The Tools Group segment’s sales dipped 0.4% year over year to $407.4 million. However, organic sales at the segment inched up 0.4%, which was partly hurt by currency headwinds. Organic sales growth was driven by increased sales at the U.S. franchise business, which was partly compensated by a decline in international operations.
Sales for Repair Systems & Information Group decreased 4.7% year over year to $339.9 million. Also, organic sales at the segment declined 3.5% from the prior-year quarter. Lower sales of to OEM dealerships and reduced sales of undercar equipment led to sales decline.
Meanwhile, the Financial Services business reported revenues of $82.7 million, up from $79.9 million in the year-ago quarter.
Further, the company’s adjusted operating earnings before financial services totaled $177.8 million, down 5.9% from $188.9 million in the prior-year quarter.
Adjusted operating income declined 3.9% to $233.9 million while adjusted operating margin contracted 50 basis points (bps) to 22.6%.
Financials
At the end of 2018, Snap-on’s cash and cash equivalents summed $140.9 million compared with $92 million at the end of 2017. The company’s long-term debt came in at $946 million, up from $753.6 million recorded at the end of 2017.
Looking Ahead
Management remains impressed with the quarterly results and expects to continue with the trend in 2019. The company anticipates making progress on defined strategies for growth in 2019. This apart, Snap-on is making efforts to revive performance at the Tools Group division. It expects to leverage its capabilities in the automotive repair area beside strengthening the overall professional customer base. Apart from automotive repair, it expects to add customers from adjacent markets, newer geographies and other areas like critical industries.
Driven by these initiatives, Snap-on expects to incur capital expenditure of $90-$100 million in 2019. Further, effective income tax rate for 2019 is projected to be at par with tax rate of 24% in 2018.
Better-Ranked Stocks in the Consumer Discretionary Space
Funko, Inc. (NASDAQ:FNKO) has average long-term earnings growth rate of 22%. The company currently sports a Zacks Rank #1 (Strong Buy). You can see the complete list of today’s Zacks #1 Rank stocks here.
Central Garden & Pet Company (NASDAQ:CENTA) has average long-term earnings growth rate of 6.1% and it currently carries a Zacks Rank of 2 (Buy).
Vista Outdoor Inc. (NYSE:VSTO) , also a Zacks Rank #2 stock, delivered average positive earnings surprise of 42.9% in the trailing four quarters.
Zacks' Top 10 Stocks for 2019
In addition to the stocks discussed above, wouldn't you like to know about our 10 finest buy-and-holds for the year?
From more than 4,000 companies covered by the Zacks Rank, these 10 were picked by a process that consistently beats the market. Even during 2018 while the market dropped -5.2%, our Top 10s were up well into double-digits. And during bullish 2012 – 2017, they soared far above the market's +126.3%, reaching +181.9%.
This year, the portfolio features a player that thrives on volatility, an AI comer, and a dynamic tech company that helps doctors deliver better patient outcomes at lower costs.
See Stocks Today >>
Vista Outdoor Inc. (VSTO): Free Stock Analysis Report
Snap-On Incorporated (SNA): Free Stock Analysis Report
Central Garden & Pet Company (CENTA): Get Free Report
Funko, Inc. (FNKO): Free Stock Analysis Report
Original post
Zacks Investment Research