Sector ETF Week In Review For June 10-14
Summary
- Defensive sectors won the day last week.
- The longer-term table is mixed, but aggressive and defensive sectors are performing on equal terms.
- Investors should maintain a defensive posture.
The market is still trending towards defensive sectors. Investors are advised to over-allocate towards utilities, staples, and real estate. Health care - another defensive sector - is mixed due to increased talk of regulation and generally negative press.
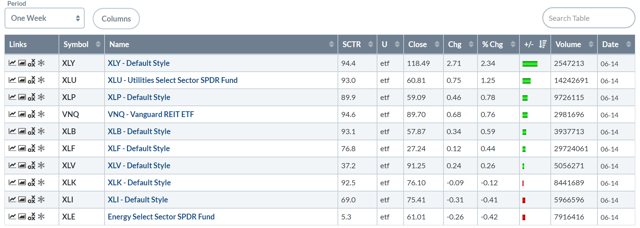
Let's start with last week's performance table:
Overall, 7/10 industries rose, but the pace of increase was less than impressive. Consumer discretionary (+2.34) led the pack, indicating a potentially aggressive stance. However, defensive sectors (utilities, staples, and real estate) fill out the top four. Technology - a key sector for bulls - was off marginally.
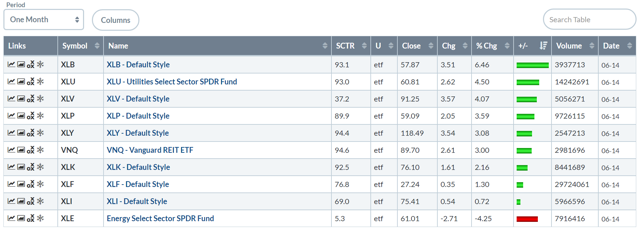
The 1-month table is defensive as well.
Basic Materials are higher, not due to increasing global growth (in fact, there is continued weakness in trade which is a net negative for the sector) but lower interest rates. But like the 1-week table, defensive sectors fill out the top four spots. Tech and discretionary's performances are modest at best. Once again, Energy is down.
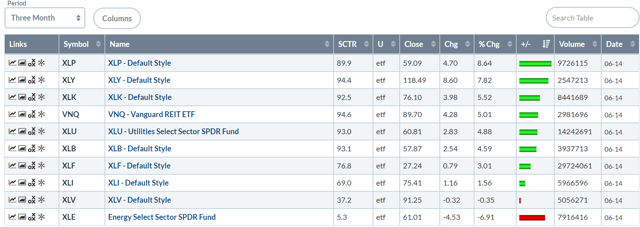
The 3-month table is mixed. The top four spots are half aggressive and half defensive. However, staples (the top performing sector) rose 1% more than discretionary (which holds the number two spot) and real estate is only underperforming technology by 50 basis points (spots three and four). In other words, from a performance perspective, the results are fairly evenly mixed between bullish and bearish sectors.
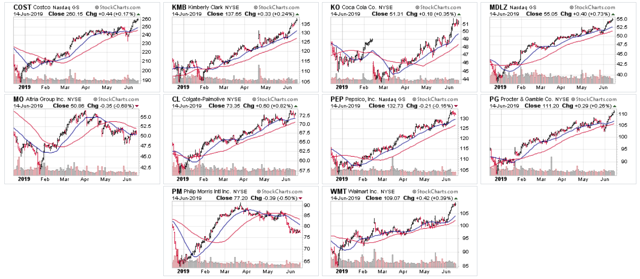
Let's take a deeper look at the top ten stocks of the key defensive sectors, starting with consumer staples:
All the charts above are for the 6-month time frame. With the exception of the tobacco companies (Altria (NYSE:MO), middle row, far left and Philip Morris (NYSE:PM), bottom left), all are in solid southwest to northeast upward sloping patterns. The corresponding moving averages (20-day in blue and 50-day in red) all show strong bullish trends.
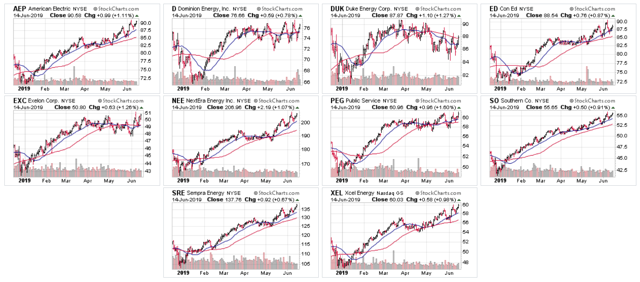
The 10 largest components of the utility sector also have bullish charts:
With the exception of Duke Energy Corporation (NYSE:DUK) (top row, second from right), all the above charts are either rallying or in the process of consolidating sideways. With the markets believing that the Fed is now more likely to cut rates, expect this sector to move sideways as a worst-case scenario.
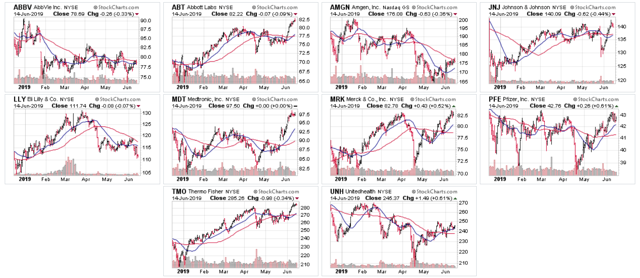
Let's next look at the XLV's 10 largest holdings.
Because of negative press (high prescription drug prices, high health insurance costs, increased talk of nationalizing health care from the political left), this sector's charts are mixed. Three issues (AbbVie (NYSE:ABBV), top row, far left; Amgen (NASDAQ:AMGN), top row, second from right; Eli Lilly (NYSE:LLY) middle row, far left) are bearish. Four charts (Abbott Laboratories (NYSE:ABT), top row, second from left; Medtronic (NYSE:MDT), Merck & Company Inc (NYSE:MRK), and Pfizer (NYSE:PFE), middle right charts) are bullish. The others are mixed.
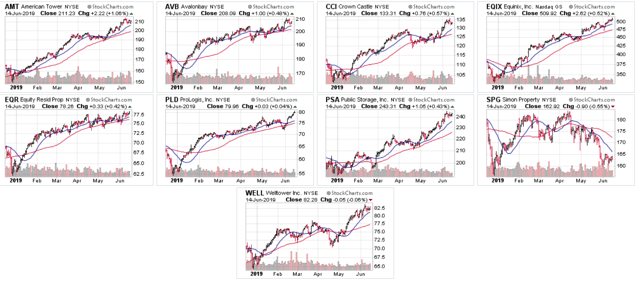
Finally, there are the nine largest members of the Vanguard REIT (NYSE:VNQ) (the largest holding is a Vanguard Fund).
With the exception of Simon Property Group (NYSE:SPG) (middle row, far right), the nine largest members of the VNQ are all rallying. Note the strength of the moving averages; again, with the exception of Simon Property Group, each 20 line (in blue) and 50 line (in red) is moving higher, with the 20 above the 50 and prices using the moving averages for technical support.
The above data is very clear: defensive sectors have the strongest bid in the market. With the exception of health care, the largest components of each respective ETF have solid charts and are moving higher.

