After today, the payroll report seems like child's play
The thing about tables is, they ALWAYS turn; the same can be said of market trends.
Just as I was preparing to type the sentence, "In my decade+ experience as a commodity broker, I've never seen anything like what we saw in the euro today", a correspondent on CNBC pointed out the March 2009 euro rally. On March 18th of 2009, the Fed announced a round of Quantitative Easing that sent the dollar reeling and the euro soaring. On that particular day, the euro was up about 3.5%. At the peak of trade today, I believe the euro was up about 3.3%. (I'd to the math, but it won't change anything and I've had a long day).
Ironically, we had been looking for the seasonal euro rally for several weeks with a short put strategy, but couldn't justify holding on to the trade into the ECB meeting. Instead, we decided to buy back our puts and sell strangles; a decision that, and the time, was sound in nature; but in hindsight was horrible. We were bullish, why get into a neutral strategy?
Nevertheless, after a lot of intraday shucking and jiving, we appear to have survived. Unfortunately, I'm not sure many traders survived the day. The way the euro was running high in clips of 10 to 20 pips at a time, is a clear indication of margin call buying and risk manager liquidation of futures accounts. We suspect the margin calls will continue into the night session and tomorrow (and this includes the ES). So look for another round of selling in the ES, and buying in the euro. We've heard rumours of some big hedge fund blow ups, and I can assure you there are enough retail trader casualties to fill a large graveyard.

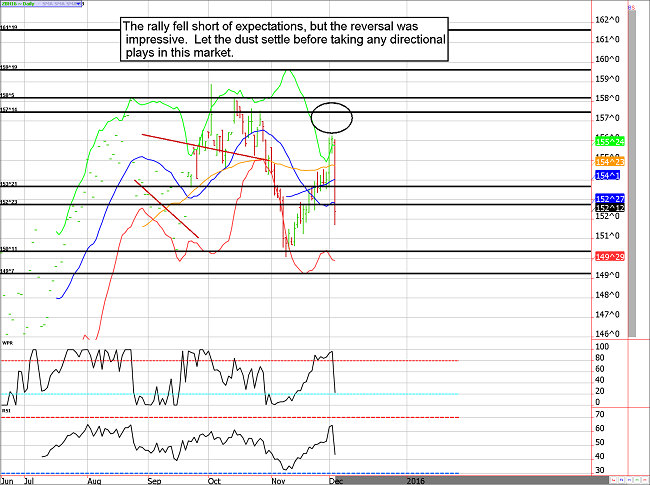
The chart told us the Treasury futures rally was over, but we didn't listen
Before today, Treasury charts were screaming "overbought" and waiving red caution flags to anyone still long the market. Although we certainly recognized the market was due for a pullback before resuming the seasonal rally, we absolutely failed to see such a massive day of selling. In hindsight, it is easy to see the signs, but in real time the bond market had seasonals it its favor, and no other troubling indicator (the COT Report was neutral to bullish the ZN, market correlations to currencies were mixed, and the Fed was likely to implement a "one and done" campaign). This example just goes to show how important the chart is. Once the oscillators were screaming saturation, the buying dried up.
We aren't sure what to make of the current chart setup, other than stating the next opportunity for the bulls won't be seen until the 149/150 area.
Treasury Futures Market Analysis
**Bond Futures Market Consensus:** The bears won this battle. Follow through selling could see the 150 area in the ZB. The bulls might want to get interested down there.
You should be trading the March contract now, these figures are based on March futures contract.
**Technical Support:** ZB : 149'20 and 149'07 ZN: 125'07, and 124'16
**Technical Resistance:** ZB : 152'27, 156'05, 157'14 ZN: 126'03, 127'01 and 128'19

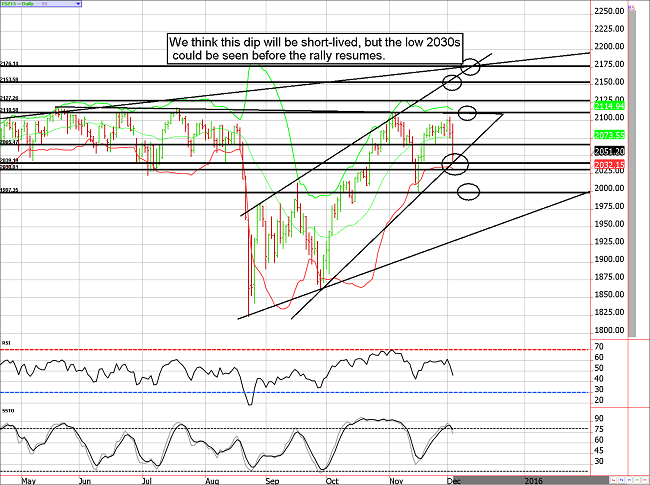
2100 WAS key technical resistance, but it the cookie didn't crumble the way we thought it would.
Resistance near 2100 in the ES was broken yesterday, but we all know now it was nothing more than a bull trap. Since that "break-out" we've seen the ES decline into the low 2040s. As discouraging as this move was, it doesn't change the facts...December are usually bullish. Also, it isn't uncommon to see an early month dip ahead of the Santa Claus rally, so there is still hope for St. Nick to deliver.
From a charting standpoint, today's low was found almost exactly at trend-line support. While I do believe we will see the low 2030s on this move as the market runs stops and reacts to tomorrow's jobs report, I believe this dip will soon prove to be a buying opportunity. Don't forget, there is a Fed meeting next week...which traditionally supports the equity markets.
Stock Index Futures Market Ideas
**e-mini S&P Futures Market Consensus:** Look to get bullish in the low 2030s. Today's panic, is most likely tomorrow's opportunity.
**Technical Support:** 2040, 2032, and 2000
**Technical Resistance:** 2072, 2100, 2109, 2153 and 2178
e-mini S&P Futures Day Trading Ideas
**These are counter-trend entry ideas, the more distant the level the more reliable but the less likely to get filled**
ES Day Trade Sell Levels: 2074, 2095, and 2106
ES Day Trade Buy Levels: 2039, 2030, and 2013
In other commodity futures and options markets....
October 16 - Buy December corn in a small fashion (mini contracts or full size, depending on risk tolerance and funding).
October 21 - Sell January natural gas $2.25 puts for about 42 ($420).
October 23 - Sell December Euro 105 put for about 30.
November 24 - Roll December corn into March to avoid delivery.
November 30 - Roll the December euro 105 put into a January 102/111 strangle to prepare for this week's event risk.
November 30 - Roll the January nat gas 225 put, into a January 210 put and a February 205 put. This gives the market some much needed breathing
room.
December 3 - Buy back the euro 102 puts to lock in a profit of anywhere from $330 to $380 per contract before commissions.
December 3 - Our January euro 111 calls are under water, let's roll them into 112/104.50 strangles at a small credit.
December 3 - After a wild day, another euro adjustment is necessary. Buy back the existing strangle (near break even), and sell the 106/113 strangle in the January euro.
Due to time constraints and our fiduciary duty to put clients first, the charts provided in this newsletter may not reflect the current session data.
Seasonality is already factored into current prices, any references to such does not indicate future market action.
**There is substantial risk of loss in trading futures and options.** These recommendations are a solicitation for entering into derivatives transactions. All known news and events have already been factored into the price of the underlying derivatives discussed. From time to time persons affiliated with Zaner, or its associated companies, may have positions in recommended and other derivatives. Past performance is not indicative of future results. The information and data in this report were obtained from sources considered reliable. Their accuracy or completeness is not guaranteed. Any decision to purchase or sell as a result of the opinions expressed in this report will be the full responsibility of the person authorizing such transaction. Seasonal tendencies are a composite of some of the more consistent commodity futures seasonals that have occurred over the past 15 or more years. There are usually underlying, fundamental circumstances that occur annually that tend to cause the futures markets to react in similar directional manner during a certain calendar year. While seasonal trends may potentially impact supply and demand in certain commodities, seasonal aspects of supply and demand have been factored into futures & options market pricing. Even if a seasonal tendency occurs in the future, it may not result in a profitable transaction as fees and the timing of the entry and liquidation may impact on the results. No representation is being made that any account has in the past, or will in the future, achieve profits using these recommendations. No representation is being made that price patterns will recur in the future.
