Weekly chart:
SCANA Corporation (NYSE:SCG) is an American energy company that provides mainly households and businesses in the states of South Carolina, North Carolina and Georgia with electricity and gas. Along with the provision of electricity, the company also focuses on the natural gas market, and distributes and markets natural resources.
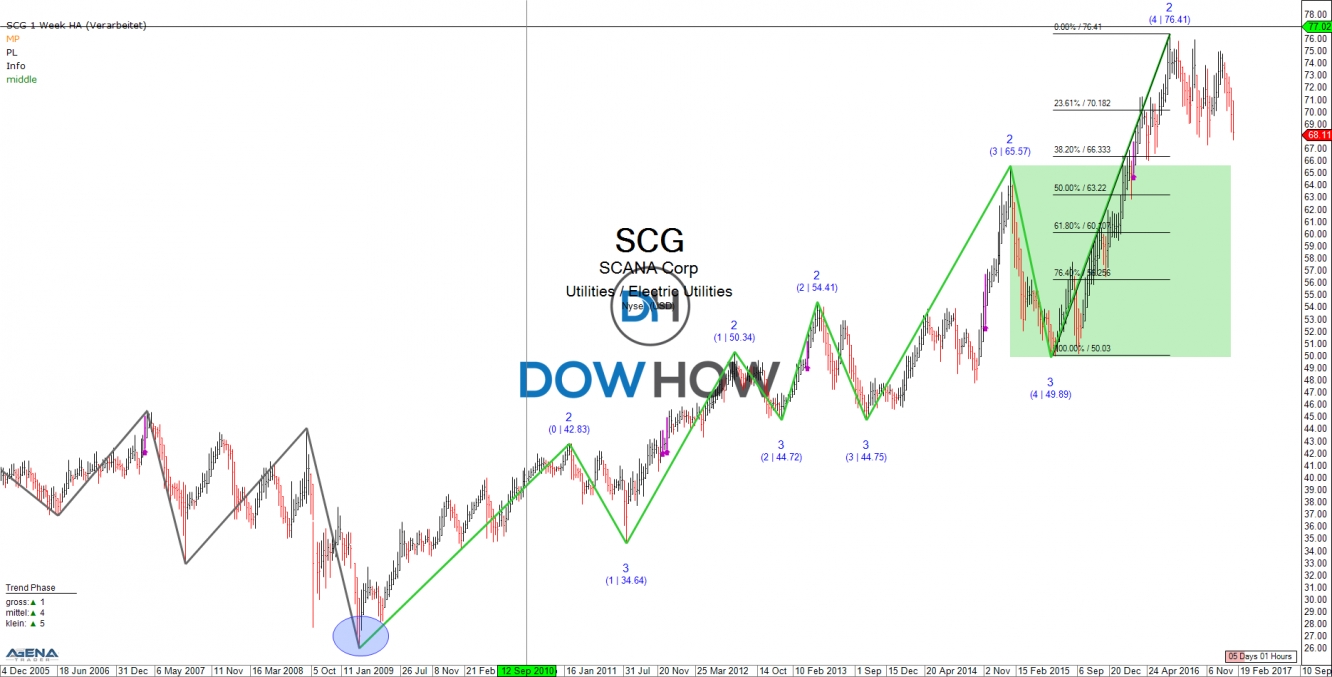
Since the last significant price slump in the year 2008, there has been only one direction for this value, and that was towards the north. Now, after the last course high at $76.41, this trend is showing a certain maturity, and is currently in the middle of a return flow.
There is plenty of space for an expansion of the correction, especially as the current correction zone only begins at $65.57, which is roughly where the 38.2% Fibonacci is also running. Such relevant markers are well known to attract the price. Of course, the correction may also dive considerably deeper into the green zone, which is why we must first wait for clear reversal signals. 
Daily chart:
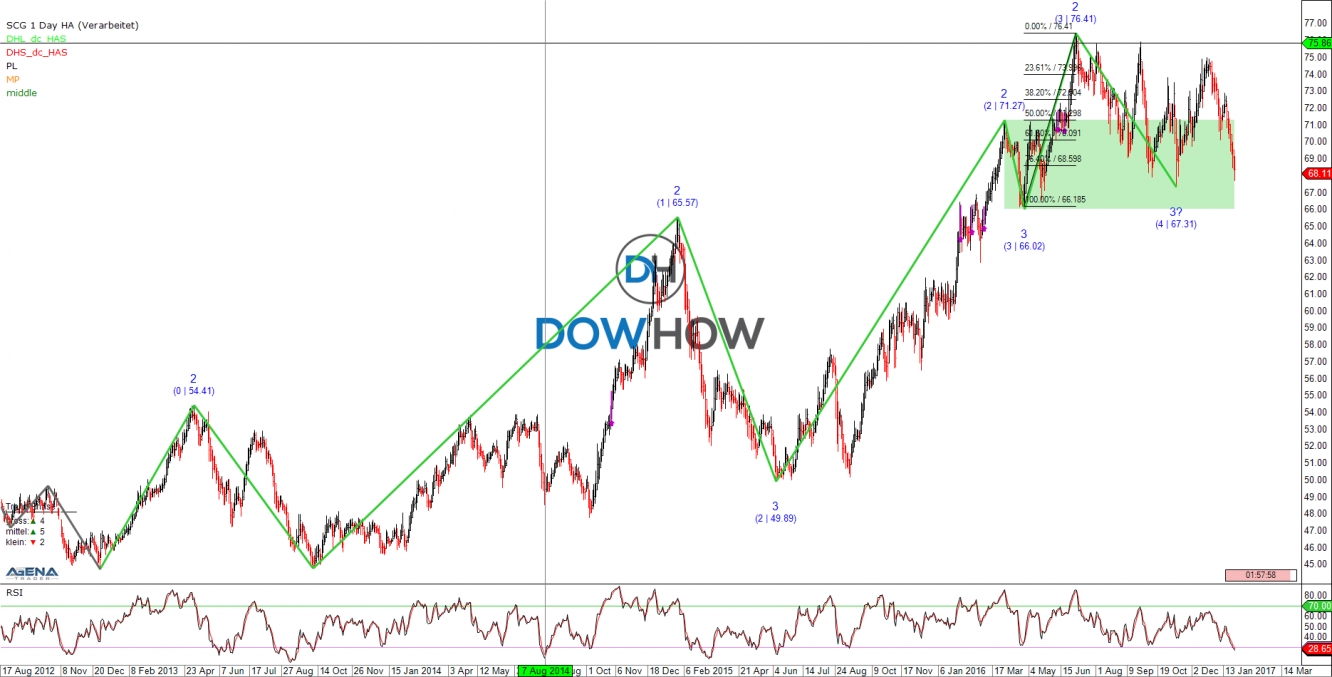
The daily chart is also showing us a mature upward trend. The correction has already run deep into the green zone, and is currently stabilising in the region of the 76.4% Fibonacci marker. The RSI is also showing a slightly oversold situation, meaning that with the corresponding reversal signals, one can assume there will be a trend continuation. Anyone working in this trend size should place the stop beneath the green zone.

Hourly chart:
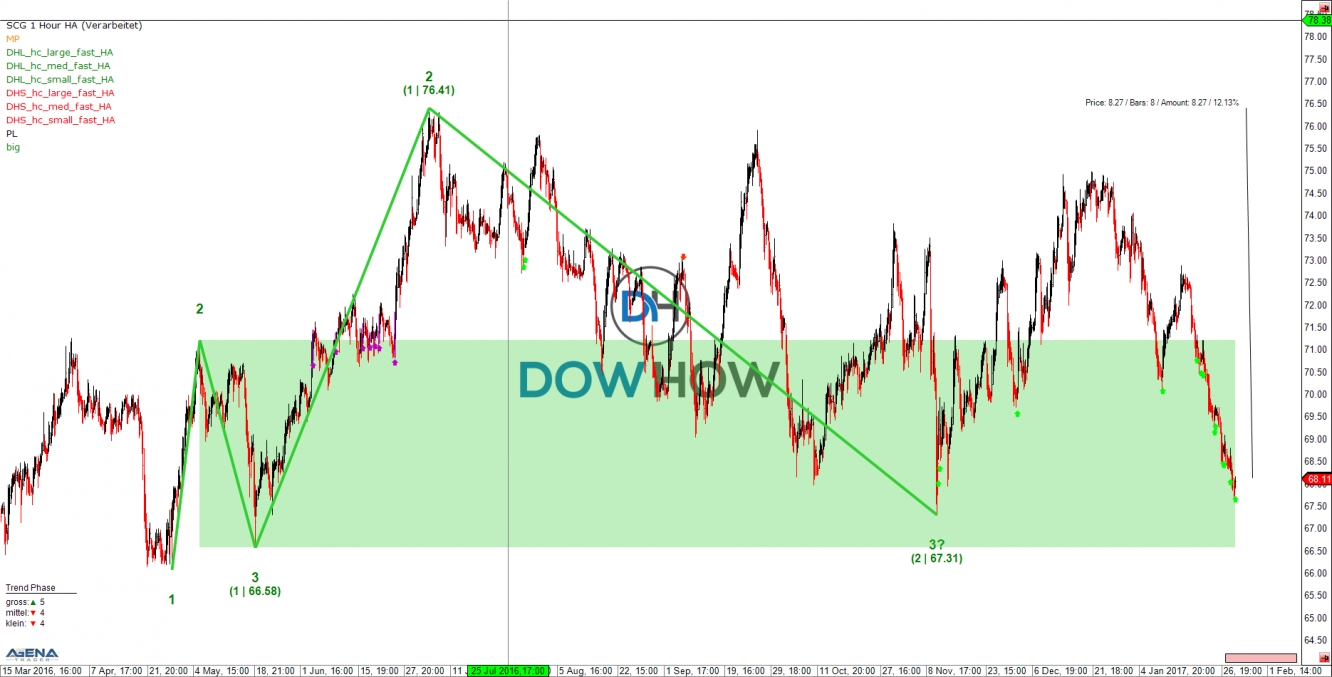
In the large trend of the hourly chart, we now find our DowHow signal. You can find out more about these signals and their derivation in my trading and education service. If one now assumes there will be a trend continuation, the price must rise until its last point two at $76.41, which is equivalent to an increase in value of around 12%. With an entry at the current price at approx. $68.50 and a stop at $66.50, an excellent trading opportunity becomes available. Nevertheless, one must take into account that in stock exchange trading, it is only ever about probabilities and a loss can occur at any time.
IMPORTANT NOTE:
Exchange transactions are associated with significant risks. Those who trade on the financial and commodity markets must familiarize themselves with these risks. Possible analyses, techniques and methods presented here are not an invitation to trade on the financial and commodity markets. They serve only for illustration, further education, and information purposes, and do not constitute investment advice or personal recommendations in any way. They are intended only to facilitate the customer’s investment decision, and do not replace the advice of an investor or specific investment advice. The customer trades completely at his or her own risk.
