Market Struggles With All-Time Highs
Last week, I started “Market Breaks Out” with the following paragraph.
“If you like volatility, then this past week was for you. On Monday, the announcement by Pfizer (NYSE:PFE) sent markets screaming higher. Subsequently, the market faded into the end of the day. Since the highs of September, the market is now just 0.50% higher today. Like I said, if you like volatility, you have gotten a good dose of it.
Fast-forward to this past Monday, and I can repeat the same opening.
“If you like volatility, then this past week was for you. On Monday, the announcement by Moderna (NASDAQ:MRNA) sent markets screaming higher. Subsequently, the market faded into the end of the day. Since the highs of September, the market is -.65% lower today. Like I said, if you like volatility, you have gotten a good dose of it.
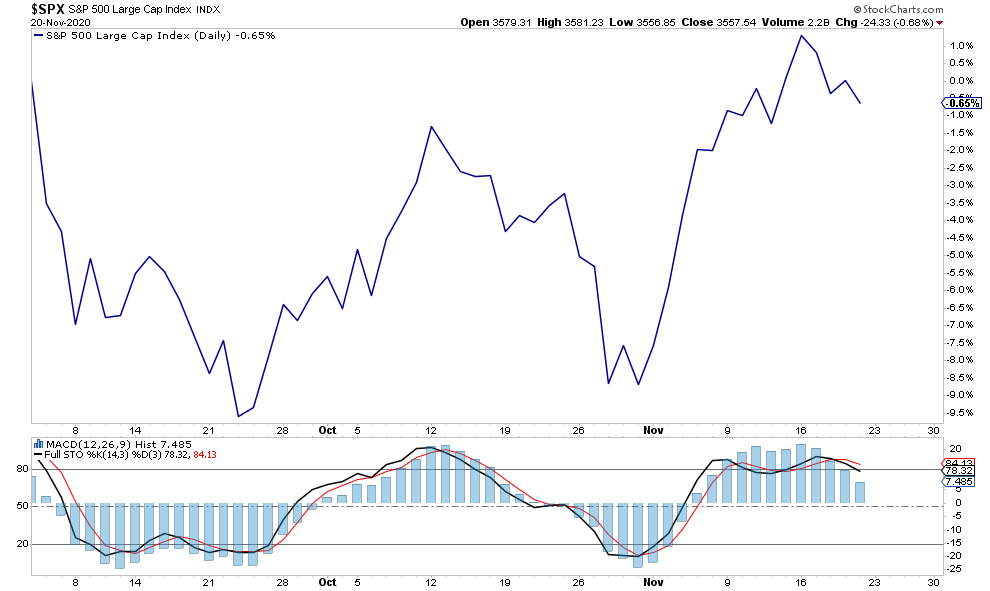
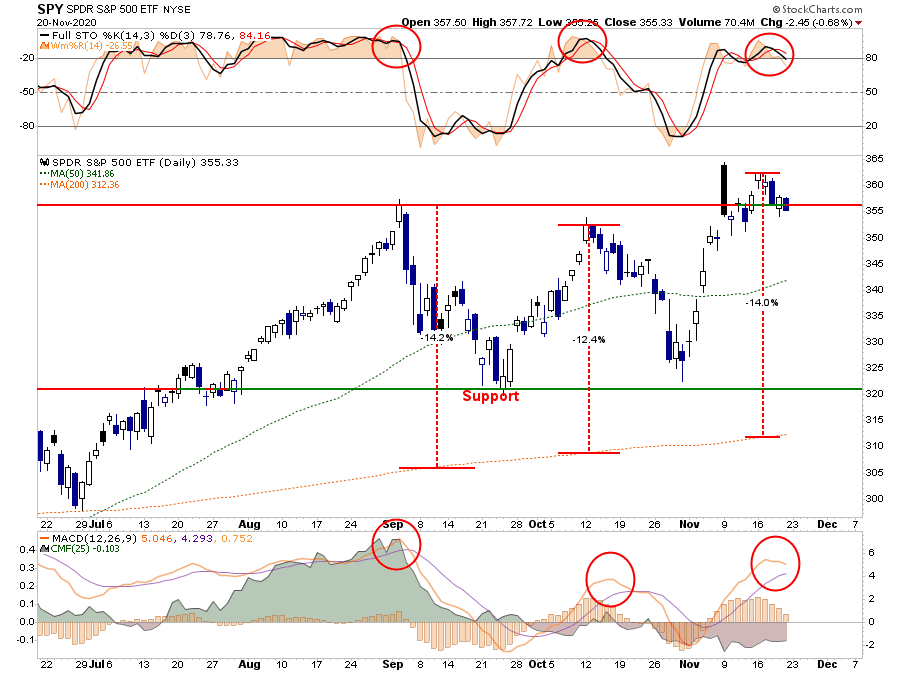
Importantly, just because the S&P 500 is overbought, extended, and deviated from long-term averages does not necessarily mean an immediate correction. Such requires a catalyst. The overbought conditions provide the fuel for the correction. (We discuss the potential catalyst in “Portfolio Positioning” below.)
However, with the market slowly “leaking” over the past week, a “sell” signal is approaching. Over the last few months, it has paid to be a bit more cautious at this point.
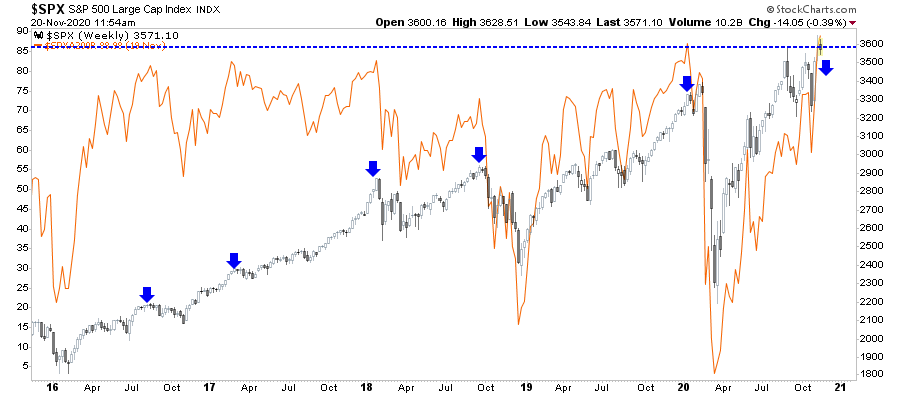
Furthermore, with the number of stocks now trading above their 200-dma at the highest level we have seen over the last 5-years, short-term corrections have often followed.
As we wrote in “Bulls Go Ballistic,” bullish sentiment has surged post-election despite rising virus cases, returning shutdowns, and lack of stimulus.
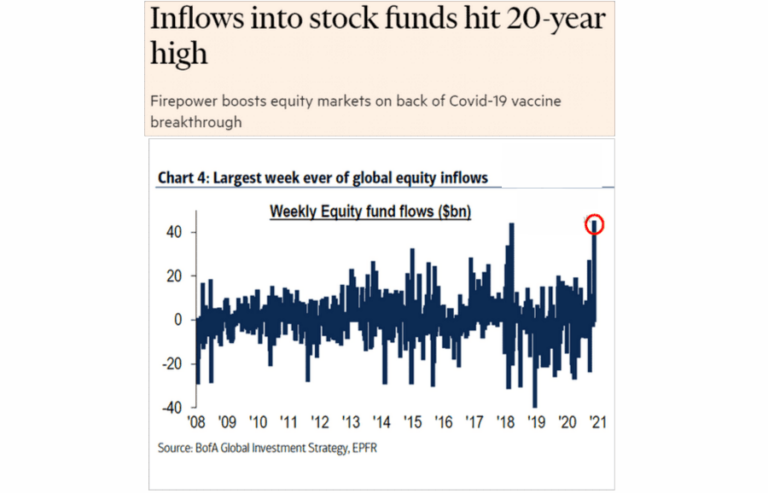
At the same time, investors are rushing in; insiders are “selling out.”
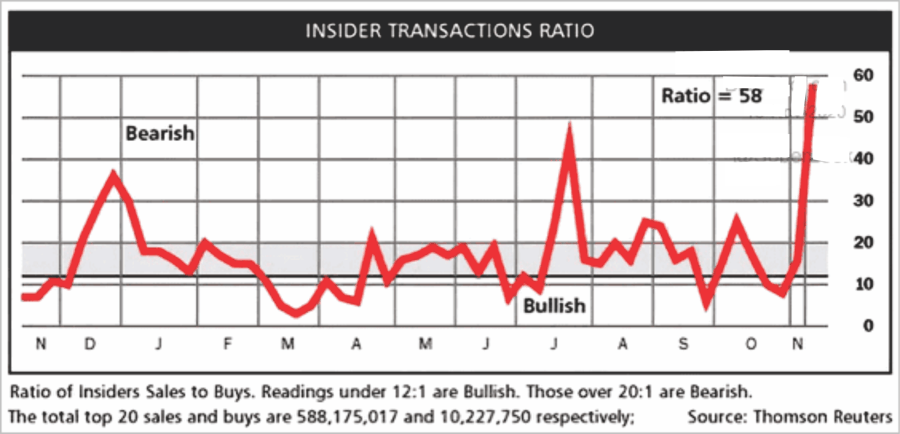
For these reasons, we continue to suggest some caution through active portfolio risk management until some of the excesses get reversed.
Sentiment Is Getting Very High
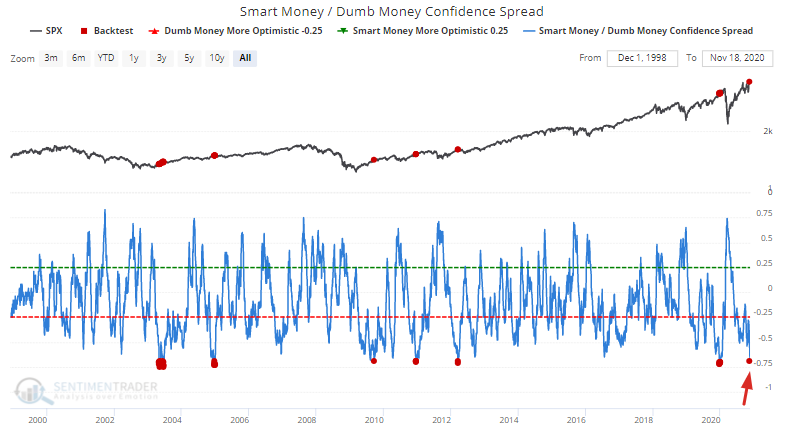
As noted, it just isn’t domestic “sentiment” becoming extended. SentimenTrader shows that sentiment has shot up to extremes on a global basis as well. To wit:
“The stock market has mostly only gone in 1 direction since March: up. Since the various pullbacks along the way were very shallow, extremely optimistic sentiment never had a chance to properly wash out. As a result, sentiment across the world is now at sky-high levels. For example, our Smart Money/dumb Money Confidence Spread is at -0.69, one of the lowest readings ever.”
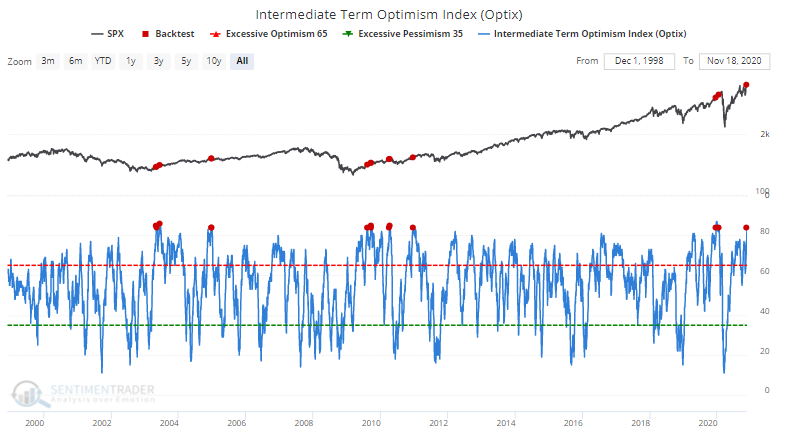
And optimism on an intermediate-term basis is at one of its highest readings of 83.
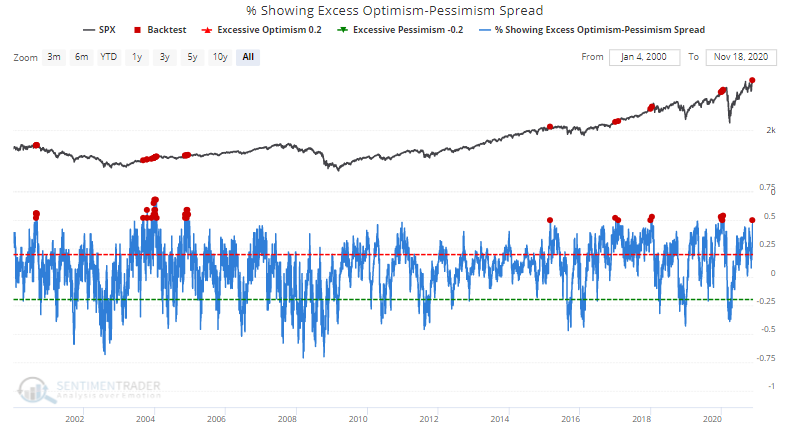
Importantly, and as we discussed on Tuesday, there is a plurality of indicators showing simultaneous outbreaks of optimism.
Buy The Rumor. Sell The News.
Jeffrey Marcus summed up our thoughts well in his Monday morning post to RIA Pro Subscribers:
“The recent rally has been driven by the former losers and much of this performance happened after the PFEs 11/9 announcement of very positive vaccine data. The moves since 11/9 are so dramatic that they have destroyed many statistical models.
Jon Quigley who manages $3.8 billion wrote to clients, that events that happened statistically should never happen. The occurrence statistically only happens roughly once every:
‘5,944,505,312,905,660,000,000,000,000,000,000,000,000,000,000,000,000,000,000,000,000,000,000,000,000,000 days in a normally-distributed return series, (Bloomberg 11/13/20).’
How long exactly is that? It equates to roughly
- 1 in every 1.629 x 10^76 years, OR
- 1.2 x 10^66 age of the universe.
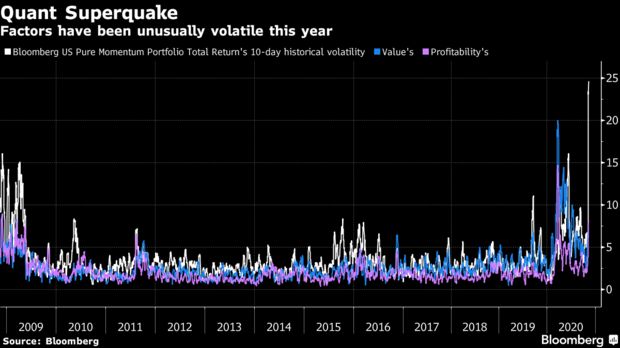
“In a market run in part by models, machines, and day-traders, this probably should not have been a surprise. Its not a coincidence were seeing more 6 sig+ moves relative to history, Cem Karsan, founder of Aegea Capital Management LLC, tweeted, using the symbol denoting standard deviation.
These arent your fathers equity markets.
Jeff concludes with two questions.
- Is the current relative performance pattern sustainable?
- Should we now expect more fat-tail events?
His answers were simplistic:
- Maybe not; and,
- Definitely.
So You Are Saying A “Crash” Is Coming?
No, that’s not what I am saying, implying, or even remotely suggesting.
For some reason, the markets have become more bipartisan than politics – with ‘bulls’ and ‘bears’ both ‘social distancing’ as much as possible.” – Real Investment Show
When it comes to investing, being either “bullish” or “bearish” is detrimental to your long-term returns. Confining yourself into one “camp” or the other stops you from evaluating data that may run contrary to your view. In behavioral finance, such is called “confirmation bias.”
To be a successful investor long-term, you must evaluate data for what it is and make decisions even if it runs contrary to mainstream views.
The data tells us the current market advance is well ahead of itself in the short-term. Historically, when “optimism” levels get to more extreme levels, the markets have experienced short- to intermediate-term corrections at the least, and sometimes more.
It is worth repeating my concluding point from last week:
“When people take ‘a little risk’ and get rewarded for it, they are then encouraged to take ‘a little more risk.’ As my colleague Victor Adair notes, ‘People in the ‘crowd’ don’t appreciate the risks they are taking because they’re surrounded by people who believe the market will keep going up.'”
Such is currently the case. Everyone is now thoroughly convinced that markets can not go down due to the Federal Reserve interventions.
Maybe they are right? Perhaps this time is different?
Unfortunately, it usually just about the time “the crowd” becomes overly optimistic that an unexpected outcome occurs.
As Bob Farrell once quipped:
“When all experts agree, something else usually happens.”
Valuations Vs. Momentum
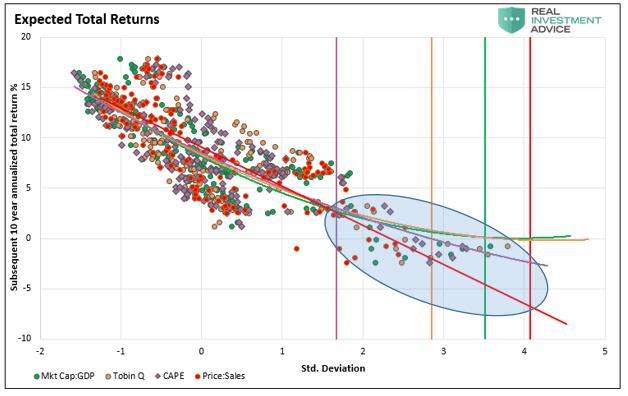
My partner, Michael Lebowitz, penned an excellent piece this week on valuations and long-term returns. I highly suggest reading the entirety of the article, but here is the crucial point.
“Regardless of the economic environment, taking significant risks, and accepting pitiful expected returns is a bad idea. The average of the 10-year expected returns from the four gauges is -0.75%. When the Fed backs off, whether by its design or due to inflation, slower economic growth, or massive debt overhead, rich valuations will matter.”
“The NYSE is the only place in the world that when the sign says ‘Everyday high prices’, everyone gets excited. If Walmart (NYSE:WMT) had the same sign, instead of ‘Everyday low prices’, no one would show up.” – Peter Boockvar
Running With The Herd
As we have stated, “valuations” are a terrible “market timing” indicator. However, valuations tell you everything you need to know about future returns. It is about “sentiment” and “herd psychology” more than anything else in the very short-term.
As my colleague, Doug Kass observed on Thursday in his “Real Money Diary.”
‘Time and time again traders and investors robotically and often emotionally follow price and ignore the simple notion that higher stock prices are the enemy of the rational buyer and lower prices are the ally of the rational buyer.
Too often as stock prices rise, investors cheer and commonly ignore the consequences of buying at a high and elevated entry price.
And, too often as stock prices drop, investors panic and commonly ignore the consequences of selling at a low and depressed exit price.
Thanks to a changing market structure, where active investing is overwhelmed by passive investing, mentalities have changed. Such also helps explain the popularity and proliferation of exchange-traded funds, quant strategies, and products that worship at the altar of price momentum. In its essence, ‘buyers live higher and sellers live lower.’
This evolution in market structure has arguably resulted in the least informed investor base in history as machines and exchange-traded funds know nothing about price and everything about value.”
The problem is volatility has become a “wicked master.” As we saw in March, the “elevator down” can come swiftly. With investors piling into ETFs, and algorithmic quant strategies chasing momentum, markets will be more susceptible to wild future swings. When investors and robots try to “exit the theater” simultaneously, the drops will be swift with little notice.
Portfolio Positioning Update
Last Monday, just after Moderna made their vaccine announcement, I tweeted:
Our job is to adjust our allocations to capture profits and protect capital when the “risk/reward” profile becomes unbalanced. On Monday, we reduced our exposure by increasing our bond holdings last Wednesday and raising cash levels Monday. Such was the point I made Tuesday in our “3-Minutes” video.
A Catalyst For A Decline
When markets are incredibly exuberant and extended, all that is needed to spark a short-term corrective process is a “catalyst.”
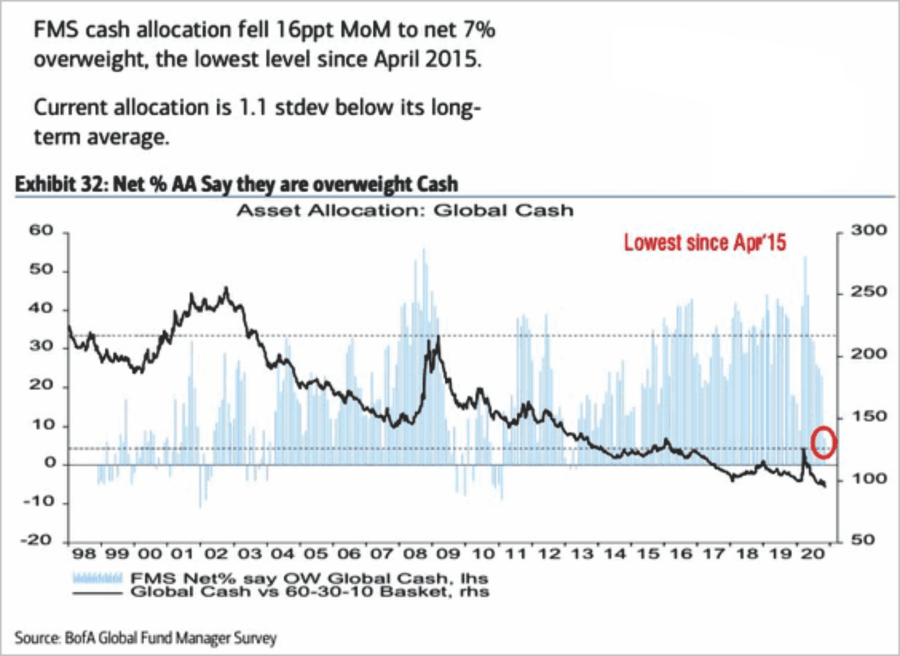
Following Thanksgiving and into the first two weeks of December, mutual funds must distribute their capital gains and interest for the year. As shown below, fund managers are carrying some of the lowest cash balances on record; we could see selling pressure to make distributions.
We Play The Probabilities
While many will read this article as being “bearish,” it isn’t.
As portfolio managers, we manage the risk of capital loss against the potential for reward. In other words, we “we prepare for the probabilities, but leave room to adjust for the possibilities.”
No one knows with certainty what the future holds, which is why we must manage portfolio risk accordingly and be prepared to react when conditions change.
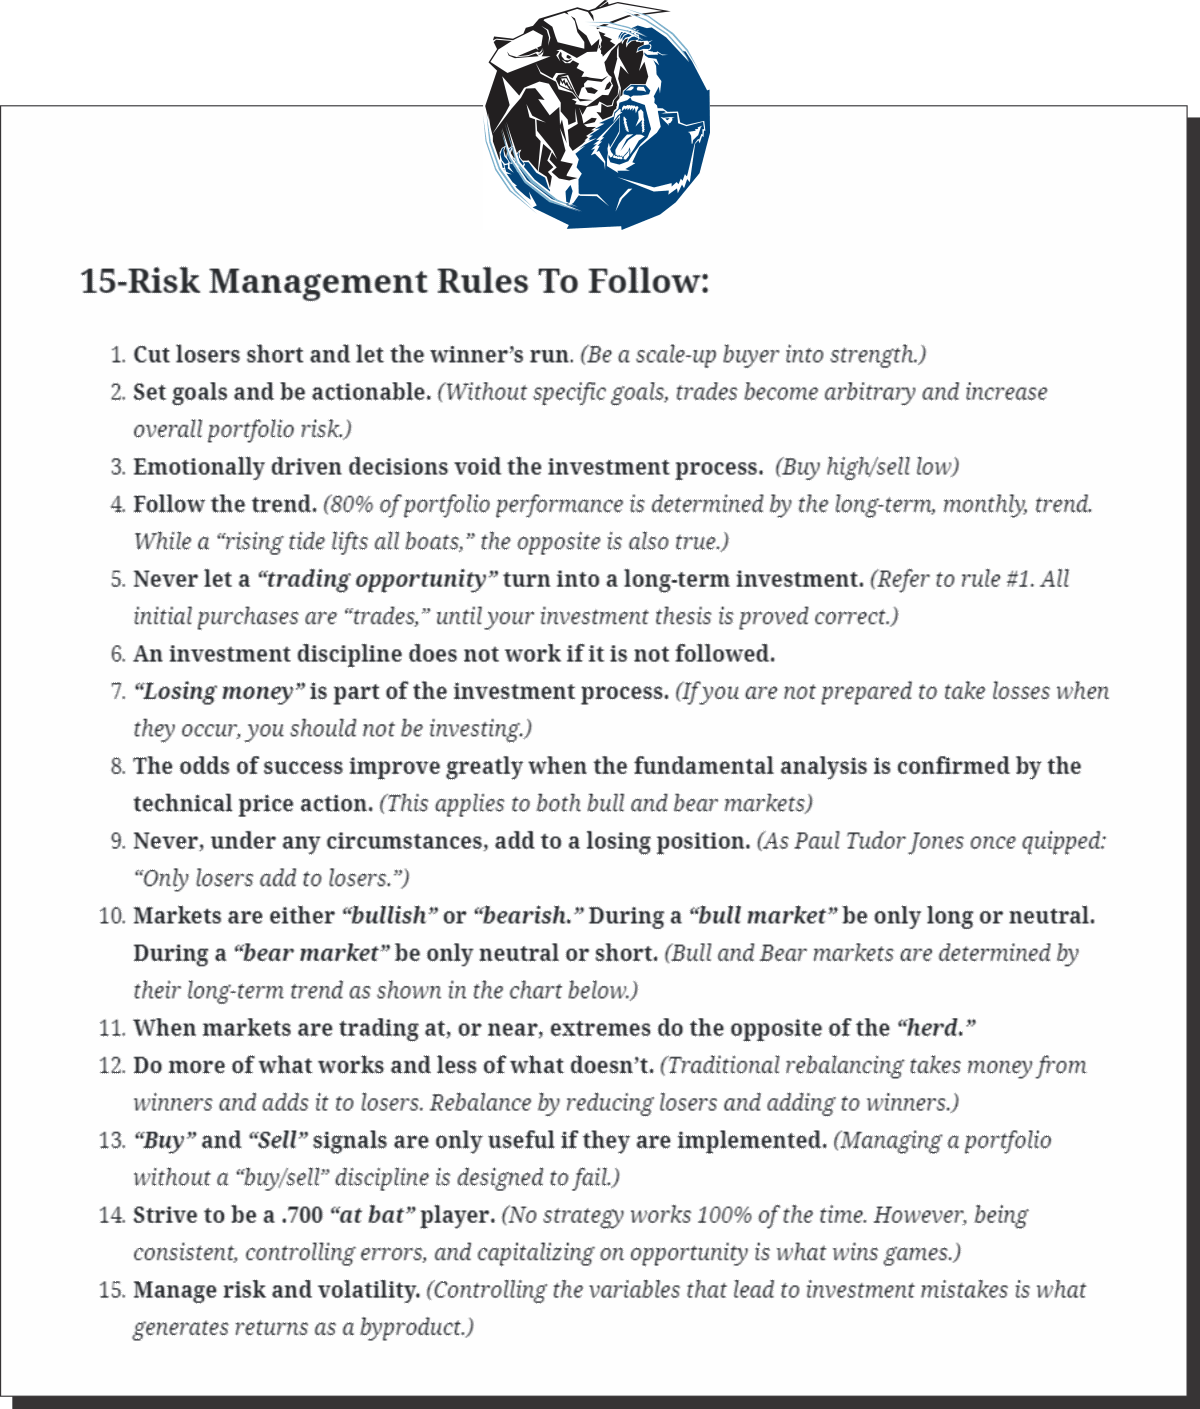
I am neither bullish nor bearish. I follow a straightforward set of rules that are the core of our portfolio management philosophy. We focus on capital preservation and long-term “risk-adjusted” returns. Importantly, no discipline is perfect. Nothing works “all the time.”
However, any discipline or strategy works better than “no strategy at all.”
Everyone approaches money management differently.
Such is just the way we do it.
