The Q3 earnings season has come to an end for half of the 16 Zacks sectors in the S&P 500. Except for the Retail sector, most of the other sectors are close to the finish line as well. This week will bring results from more than 100 companies, including 24 S&P 500 members.
The Retail sector is heavily represented in this week’s reports, with industry leaders like Home Depot (NYSE:HD), Target (NYSE:TGT) and Gap (NYSE:GPS) reporting Q3 results. The sector has been struggling on the earnings front in recent quarters and this reporting cycle has been no different. The heavily promotional environment has been forcing retailers to offer discounts to stay relevant even as they deal with the growing shift to online sales.
The big brick-and-mortar retailers have been trying to adjust to this shifting landscape. But as the online struggles of many prior industry leaders show, it isn’t clear at this stage how the big-box business model will evolve as a result of these industry challenges.
Wal-Mart (NYSE:WMT), which came out with positive Q3 results on the back of first same-store sales growth in the home market, has been making good progress on its online presence. The company has been making aggressive investments in its online presence and that has started showing up in its results. Wal-Mart’s online sales were up +21% in Q3, a solid performance but lower than the first-half 2014 growth pace of about +27%. The recent drop in gasoline prices has been beneficial to Wal-Mart’s target market and will raise hopes for a better holiday season in that market segment.
On top of these industry-specific challenges are the issues facing consumers, who have yet to fully recover from the financial crisis. The labor market is no doubt improving and that has started to show up in measures of consumer confidence. But wage growth has been essentially stagnant, restricting households’ buying power. The recent drop in gasoline prices should help this holiday season, but overall it has been a tough backdrop for retailers. No doubt the stock-price performance of the retail sector in the S&P 500 has been one of the weakest in the index – up a +6.6% vs. a gain of +10.6% for the index as a whole.
Sector Results Thus Far
With respect to the sector’s performance thus far, total earnings for 27 Retail sector companies in the S&P 500 that have already reported Q3 results are up +1.6% on +5.8% higher revenues, with 70.4% beating earnings estimates and 63% coming ahead of top-line expectations. This is the second lowest earnings growth performance of all 16 sectors (Autos is the weakest) in the index. The earnings growth rate for the sector also doesn’t compare favorably with what we have been seeing from the sector in other recent quarters, as you can see in the chart below.
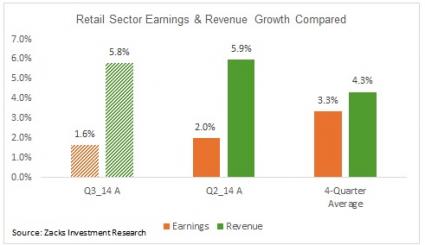
But the beat ratios tell a different story; these mediocre results came as a positive surprise to investors. As you can see in the chart below, the earnings and beat ratios for the sector are tracking better than we have seen from the same group of companies in other recent quarters.
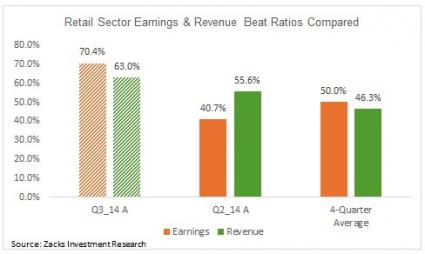
What this means is that expectations for the sector were too low, proving an easy to beat hurdle rate for many sector players. Low expectations also appear to be the most reasonable explanation for how the market reacted to the sub-part results from Macy’s (NYSE:M).
The Q3 Scorecard (as of November 14th)
We have seen Q3 results from 463 S&P 500 members that combined to account for 95.3% of the index’s total market capitalization. Total earnings for these companies are up 6.9% from the same period last year, with 71.1% of the companies beating earnings estimates. Total revenues are up 4.1% and 57.7% have come ahead of top-line estimates.
The chart below shows the current Q3 Scorecard.
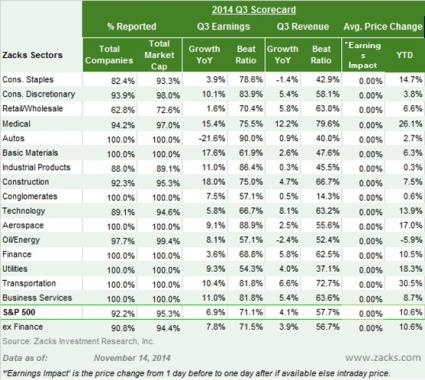
As you can see, the earnings growth rate for 7 of the 16 Zack’s Sectors is in double digits, with Construction (+18.0%), Basic Materials (+ 17.6%), and Medical (+15.4%), having the strongest growth rates. The Materials strength isn’t a reflection of increased demand for this economically sensitive sector in these troubled times, but relatively easier comparisons for the Chemicals industry (the largest industry in the sector) and Steel industries. Total earnings for the Chemicals industry, which alone accounts for roughly two-thirds of the Basic Materials sector’s total earnings, are up +23.9% on +4.5% higher revenues.
The chart below shows the industry level scorecard for the Basic Materials sector.

On the flip side, we have just one sector with negative signs on the growth front, Autos down -21.6%. We know that the automakers were struggling with product recalls and the Retail sector still has plenty of reports to come. The hope is that the falling gasoline prices will help the sector this holiday season.
‘Average’ Grade for Q3 Earnings Season
Our grade for this earnings season remains ‘average’ – it isn’t good, but it isn’t bad either. To explain our ‘average’ grade, we share two types of charts below that will show how the results thus far compare with the past and what is happening to estimates for the current period (2014 Q4).
The two side-by-side charts below compare the results thus far with what we had seen from the same group of S&P 500 members in Q2 and other preceding quarters (the 4-quarter Average is the four quarters through 2014 Q2).
The left hand side chart shows the growth rate for earnings (orange) and revenues (green) and the right side chart shows the beat ratios. The data in these charts is for the 463 S&P 500 companies that have reported Q3 as of Friday November 14th.

As you can see, it’s hard to make one all-encompassing narrative for the reporting cycle, other than to say that it’s not materially different from what we have been seeing from these companies in other recent quarters, particularly on the growth front. Beat ratios appear to be diverging from the norm a bit – with Q3 earnings beats ratios tracking above recent levels while revenue beat rates are on the weak side.
One could argue that this isn’t a bad performance and we are harsh in giving this reporting cycle an ‘average’ grade. That’s a fair comment, but our grade also reflects how the results thus far, particularly management guidance, are impacting estimates for the current period (2014 Q4)
The chart below shows what’s happening to Q4 estimates as companies have been releasing Q3 results. As you can see, estimates are moving down.
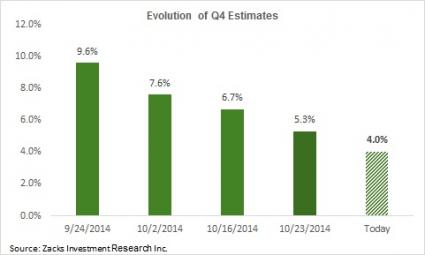
This negative revision trend isn’t new either – we have been seeing this quarter after quarter for more than two years now. In some respects, the pace and magnitude of the negative revisions at this stage is exceeding what we had been seeing at comparable stages in the last few quarters.
The Composite Picture
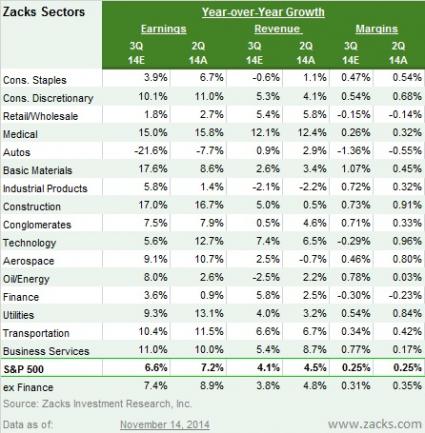
The table below shows a composite (or blended) summary picture of Q3 combines actual results from the 463 S&P 500 members that have reported with estimates from the remaining 37 index members. As you can see, total earnings are expected to be up 6.6% from the same period last year on 4.1% higher revenues and modest margin gains. The expected growth rate for Q3 has been steadily improving in recent days as companies report results and beat estimates.
Note: Want more articles from this author? Scroll up to the top of this article and click the FOLLOW AUTHOR button to get an email each time a new article is published.
Note: For a complete analysis of 2014 Q3 estimates, please check out our weekly Earnings Trends report.
Here is a list of the 106 companies reporting this week, including 24 S&P 500 members.
| Company | Ticker | Current Qtr | Year-Ago Qtr | Last EPS Surprise % | Report Day | Time |
| AGILENT TECH | A | 0.5 | 0.81 | 5.41 | Monday | AMC |
| JACOBS ENGIN GR | JEC | 0.85 | 0.84 | 5 | Monday | AMC |
| TYSON FOODS A | TSN | 0.77 | 0.7 | -9.64 | Monday | BTO |
| URBAN OUTFITTER | URBN | 0.42 | 0.47 | 0 | Monday | AMC |
| ALCOBRA LTD | ADHD | -0.61 | -0.28 | 1.72 | Monday | BTO |
| AIRMEDIA GP-ADR | AMCN | 999 | -0.06 | N/A | Monday | AMC |
| CONCORD MED-ADR | CCM | 0.07 | 0.1 | 30 | Monday | AMC |
| CHINA MOBIL-ADR | CMGE | 0.31 | 0.17 | 28.57 | Monday | BTO |
| CORIUM INTRNTNL | CORI | -0.32 | 999 | -64.71 | Monday | AMC |
| FOAMIX PHARMA | FOMX | -0.07 | 999 | N/A | Monday | BTO |
| HANGER ORTHOPED | HGR | 0.45 | 0.62 | -24.53 | Monday | AMC |
| INTEGRAL TECH | ITKG | -0.01 | -0.02 | N/A | Monday | AMC |
| IMAGEWARE SYS | IWSY | -0.02 | 0 | 0 | Monday | AMC |
| JD.COM INC-ADR | JD | -0.05 | 999 | -1650 | Monday | BTO |
| MILESTONE SCI | MLSS | 999 | 0.01 | -200 | Monday | AMC |
| PROSENA HLDG BV | RNA | -0.25 | -0.16 | 19.44 | Monday | BTO |
| ULURU INC | ULUR | -0.01 | -0.05 | -50 | Monday | BTO |
| HOME DEPOT | HD | 1.13 | 0.95 | 5.56 | Tuesday | BTO |
| MEDTRONIC | MDT | 0.96 | 0.91 | 1.09 | Tuesday | BTO |
| PETSMART INC | PETM | 0.95 | 0.88 | 4.26 | Tuesday | AMC |
| TJX COS INC NEW | TJX | 0.85 | 0.75 | 2.74 | Tuesday | BTO |
| AFFIMED THERAP | AFMD | -0.33 | 999 | N/A | Tuesday | BTO |
| CYREN LTD | CYRN | -0.02 | 0 | -66.67 | Tuesday | BTO |
| DICKS SPRTG GDS | DKS | 0.4 | 0.4 | 3.08 | Tuesday | BTO |
| CHINA DISTANCE | DL | 0.29 | 0.27 | 50 | Tuesday | AMC |
| GOLUB CAPITAL | GBDC | 0.31 | 0.31 | 0 | Tuesday | AMC |
| JACK IN THE BOX | JACK | 0.53 | 0.45 | 14.04 | Tuesday | AMC |
| JA SOLAR HOLDGS | JASO | 0.15 | -0.37 | -17.65 | Tuesday | BTO |
| LA-Z-BOY INC | LZB | 0.34 | 0.32 | -4.76 | Tuesday | AMC |
| MANCHESTER UTD | MANU | -0.09 | 0.02 | -50 | Tuesday | BTO |
| MA-COM TECH SOL | MTSI | 0.28 | 0.24 | 3.57 | Tuesday | AMC |
| PALATIN TECH | PTN | 0.04 | -0.04 | -233.33 | Tuesday | BTO |
| SITO MOBILE LTD | SITO | -0.01 | -0.01 | 0 | Tuesday | AMC |
| SOC QUIMICA MIN | SQM | 0.28 | 0.53 | -30.77 | Tuesday | AMC |
| VIPSHOP HOLDNGS | VIPS | 0.06 | 0.02 | 19.15 | Tuesday | AMC |
| VALUEVISION MDA | VVTV | -0.02 | -0.02 | 0 | Tuesday | BTO |
| SALESFORCE.COM | CRM | -0.01 | -0.12 | -400 | Wednesday | AMC |
| KEURIG GREEN MT | GMCR | 0.78 | 0.89 | 13.79 | Wednesday | AMC |
| L BRANDS INC | LB | 0.4 | 0.31 | 1.61 | Wednesday | AMC |
| LOWES COS | LOW | 0.58 | 0.47 | 1.96 | Wednesday | BTO |
| MALLINCKRODT PL | MNK | 1.34 | 1.02 | 39.53 | Wednesday | BTO |
| SMUCKER JM | SJM | 1.53 | 1.52 | -2.19 | Wednesday | BTO |
| STAPLES INC | SPLS | 0.37 | 0.42 | 0 | Wednesday | BTO |
| TARGET CORP | TGT | 0.47 | 0.84 | 0 | Wednesday | BTO |
| ATENTO SA | ATTO | 0.39 | 999 | N/A | Wednesday | AMC |
| COPA HLDGS SA-A | CPA | 2.03 | 2.62 | 17.04 | Wednesday | AMC |
| AMERICAS CAR-MT | CRMT | 0.67 | 0.61 | 14.49 | Wednesday | AMC |
| CONSTELLIUM NV | CSTM | 0.41 | 0.53 | -19.3 | Wednesday | BTO |
| E-HOUSE CHINA | EJ | 0.09 | 0.17 | 120 | Wednesday | BTO |
| FIDELITY&GUARNT | FGL | 0.46 | 999 | 130.95 | Wednesday | AMC |
| GEOPARK LTD | GPRK | 0.27 | 0.15 | 110.53 | Wednesday | BTO |
| HILLENBRAND INC | HI | 999 | 0.5 | N/A | Wednesday | AMC |
| JUMEI INTL-ADR | JMEI | 0.13 | 999 | 18.18 | Wednesday | AMC |
| LEJU HOLDINGS | LEJU | 0.24 | 999 | -6.67 | Wednesday | BTO |
| LIGHTINTHEBOX-A | LITB | -0.1 | -0.05 | 21.43 | Wednesday | BTO |
| NORD ANGLIA EDU | NORD | -0.13 | 999 | -11.76 | Wednesday | BTO |
| REAL GOODS SOLR | RGSE | -0.14 | -0.07 | -64.71 | Wednesday | AMC |
| SEMTECH CORP | SMTC | 0.34 | 0.27 | 20.69 | Wednesday | AMC |
| STAGE STORES | SSI | -0.2 | -0.26 | -31.37 | Wednesday | BTO |
| WILLIAMS-SONOMA | WSM | 0.63 | 0.58 | 0 | Wednesday | AMC |
| AUTODESK INC | ADSK | 0.11 | 0.31 | 41.18 | Thursday | AMC |
| BEST BUY | BBY | 0.24 | 0.18 | 41.94 | Thursday | BTO |
| DOLLAR TREE INC | DLTR | 0.65 | 0.58 | -6.15 | Thursday | BTO |
| GAMESTOP CORP | GME | 0.62 | 0.58 | 15.79 | Thursday | AMC |
| GAP INC | GPS | 0.79 | 0.72 | 1.45 | Thursday | AMC |
| INTUIT INC | INTU | -0.34 | -0.18 | -200 | Thursday | AMC |
| PATTERSON COS | PDCO | 0.51 | 0.48 | 4 | Thursday | BTO |
| ROSS STORES | ROST | 0.87 | 0.8 | 4.59 | Thursday | AMC |
| ARUBA NETWORKS | ARUN | 0.08 | -0.04 | -100 | Thursday | AMC |
| BUCKLE INC | BKE | 0.87 | 0.85 | -3.77 | Thursday | BTO |
| BON-TON STORES | BONT | 0.08 | -0.05 | -30.07 | Thursday | BTO |
| BRADY CORP CL A | BRC | 0.39 | 0.42 | -16.33 | Thursday | BTO |
| CERES INC | CERE | 999 | -0.29 | 46.88 | Thursday | AMC |
| CYBERONICS INC | CYBX | 0.59 | 0.5 | -5.36 | Thursday | BTO |
| JIAYUAN.COM INT | DATE | 0.02 | 0.09 | 20 | Thursday | BTO |
| DONALDSON CO | DCI | 0.42 | 0.42 | 8.51 | Thursday | BTO |
| GEOSPACE TEC CP | GEOS | 0.17 | 1.05 | -9.38 | Thursday | AMC |
| GOLD FIELDS-ADR | GFI | 0.04 | 0.02 | 0 | Thursday | |
| GASLOG LTD | GLOG | 0.25 | 0.19 | 0 | Thursday | BTO |
| GREAT WSTRN BCP | GWB | 0.47 | 999 | N/A | Thursday | BTO |
| JINKOSOLAR HLDG | JKS | 0.71 | 1.36 | 15.94 | Thursday | BTO |
| KIRKLANDS INC | KIRK | 0.03 | 0.06 | -50 | Thursday | BTO |
| LIQUIDITY SVCS | LQDT | 0.09 | 0.35 | 13.64 | Thursday | BTO |
| MOBILEYE NV | MBLY | 0 | 999 | -100 | Thursday | BTO |
| MENTOR GRAPHICS | MENT | 0.09 | 0.27 | 216.67 | Thursday | AMC |
| MICHAELS COS | MIK | 0.26 | 999 | 87.5 | Thursday | BTO |
| MARVELL TECH GP | MRVL | 0.23 | 0.24 | 31.82 | Thursday | AMC |
| NATURAL GROCERS | NGVC | 0.13 | 0.1 | -6.25 | Thursday | AMC |
| PERRY ELLIS INT | PERY | 0.06 | -0.15 | 38.46 | Thursday | BTO |
| CHILDRENS PLACE | PLCE | 1.8 | 1.89 | 17.78 | Thursday | BTO |
| RENREN INC-ADR | RENN | -0.12 | -0.07 | 212.5 | Thursday | AMC |
| SPECTRUM BRANDS | SPB | 1.12 | 0.88 | 0.78 | Thursday | BTO |
| SPLUNK INC | SPLK | -0.35 | -0.13 | -51.52 | Thursday | AMC |
| FRESH MARKET | TFM | 0.28 | 0.23 | 2.86 | Thursday | AMC |
| TORCHLIGHT EGY | TRCH | -0.05 | -0.24 | -200 | Thursday | AMC |
| WESCO AIRCRAFT | WAIR | 0.37 | 0.33 | -8.33 | Thursday | AMC |
| 500.COM LTD-A | WBAI | 0.4 | 0.08 | 112.5 | Thursday | BTO |
| ZOES KITCHEN | ZOES | 0.04 | 999 | 100 | Thursday | AMC |
| ANN INC | ANN | 0.7 | 0.89 | 0 | Friday | BTO |
| BERRY PLASTICS | BERY | 0.37 | 0.33 | 41.67 | Friday | BTO |
| DESTINATION XL | DXLG | -0.1 | -0.08 | -66.67 | Friday | BTO |
| FOOT LOCKER INC | FL | 0.78 | 0.68 | 18.52 | Friday | BTO |
| HIBBET SPORTS | HIBB | 0.62 | 0.66 | 3.23 | Friday | BTO |
| SIRONA DENTAL | SIRO | 0.91 | 0.78 | 5.15 | Friday | BTO |
| TSAKOS EGY NAVG | TNP | 0.04 | -0.02 | 71.43 | Friday | BTO |
