The 45th president’s term ends today, putting a fork in one of the most turbulent periods in American history to rest. As the nation prepares for the the Biden era, whatever that means, let’s take a quick look at how markets fared through Donald’s tenure, based on a set of exchange traded funds.
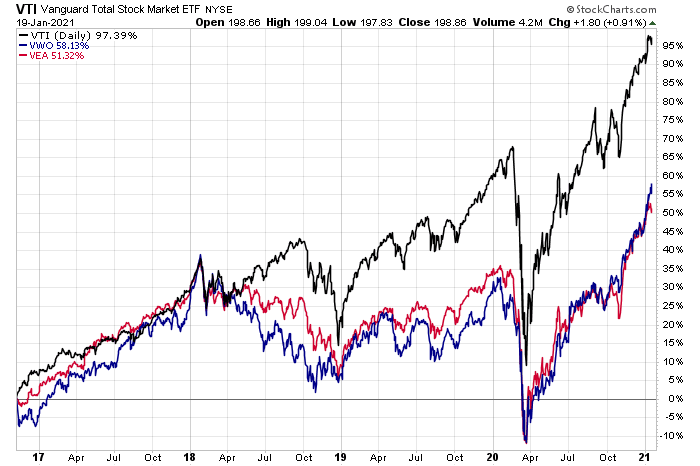
Let’s begin with a big-picture review of global equity markets via US, foreign developed and emerging markets slices from the close of Election Day in 2016 (Nov. 8) through yesterday (Jan. 19, 2021). The main takeaway on this front: US stocks (VTI) dramatically outperformed its counterparts (and the other major asset classes too). Vanguard Total US Stock Market (VTI) nearly doubled during this period with a 97% total return (all results throughout are cited as cumulative changes). Foreign shares, by contrast, rose roughly 50% to 60%, according to results for Vanguard FTSE Developed Markets (VEA) and Vanguard FTSE Emerging Markets (VWO).
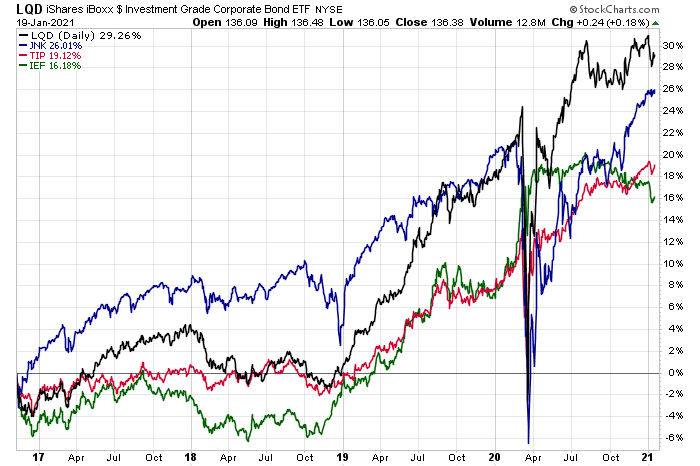
Broad measures of US bonds ended the Trump era with gains, albeit modest compared with stocks. The iShares iBoxx $ US Investment Grade Corporate Bond ETF (LQD) topped this category with 29% advance. US junk bonds (SPDR® Bloomberg Barclays High Yield Bond ETF (JNK) were a close runner-up with a 26% gain. Inflation-indexed Treasuries (TIP) and US corporates (IEF) fell into the bottom half for returns with 19% and 16% gains, respectively.
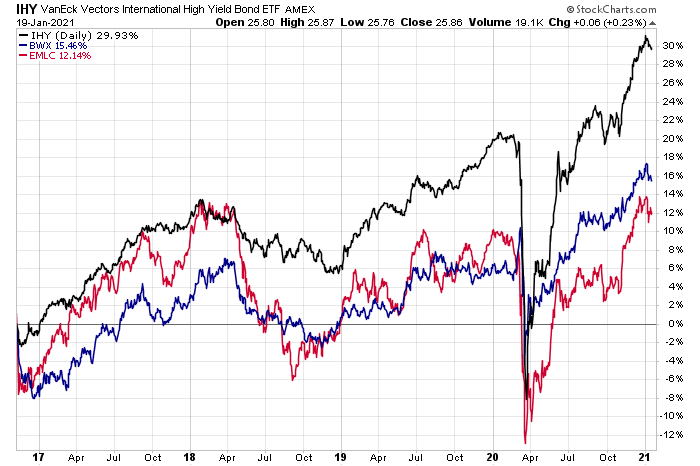
Three major categories of foreign bonds (in unhedged terms) also delivered across-the-board gains in line with US fixed-income results. Topping the ex-US fixed-income category: VanEck Vectors International High Yield Bond (IHY), which rose 30%. By contrast, foreign developed government bonds (BWX) were up a bit more than 15% while government bonds issued by governments in emerging markets added 12%.
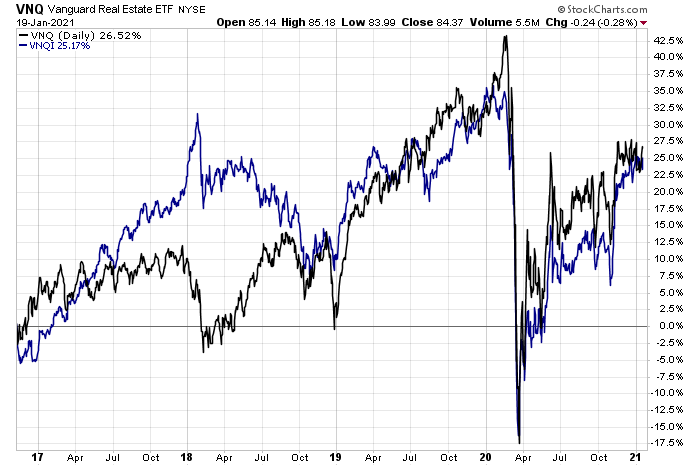
US and foreign real estate shares were essentially tied for Trump-era returns. Vanguard US Real Estate (VNQ) was up nearly 27%, slightly ahead of the 25% increase for Vanguard Global ex-U.S. Real Estate (VNQI).
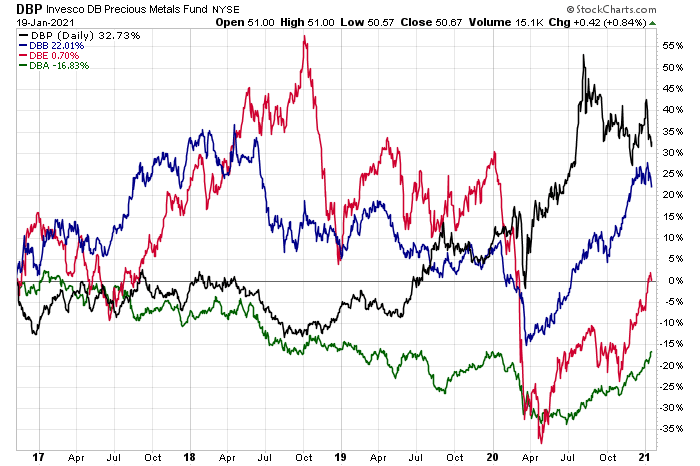
Looking at four major categories for commodities reveals a mixed picture for the Trump era, based on four fund proxies run by Invesco. Precious metals (DBP) and base metals (DBB) had profitable run, rising 33% and 22%, respectively. A broad measure of energy (DBE) was flat during the Trump years while agriculture (DBA) shed 17%.
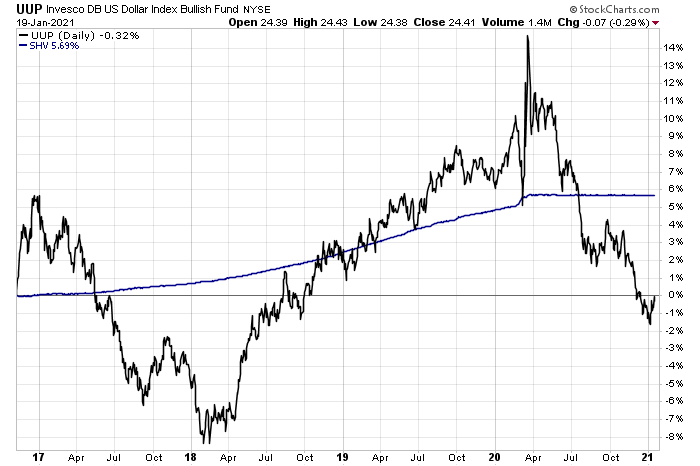
Finally, the US dollar endured a volatile ride since Trump became president but by the end of yesterday’s close the Invesco DB US Dollar Index Bullish Fund (UUP), which tracks the greenback relative to a basket of six major foreign currencies, was essentially unchanged. For comparison, an ETF proxy for a US dollar cash holding was up nearly 6%, based on iShares Short Treasury Bond (SHV).
And so ends the mostly bullish run for markets during the Trump years. As of 12:01 pm eastern today, the window is formally accepting your bets for the Biden era.
