Get 40% Off
👀 👁 🧿 All eyes on Biogen, up +4,56% after posting earnings. Our AI picked it in March 2024.
Which stocks will surge next?
Unlock AI-picked Stocks

Rallies Slow As Semiconductors Tag Resistance

Published 02/19/2018, 12:12 AM
Updated 07/09/2023, 06:31 AM

Friday saw the indices close near the lows of the day as Semiconductors tagged resistance and its 20-day MA. Supporting technicals offered a mix of bullish and bearish markets but shorts have their opportunity with a stop above 1,334.
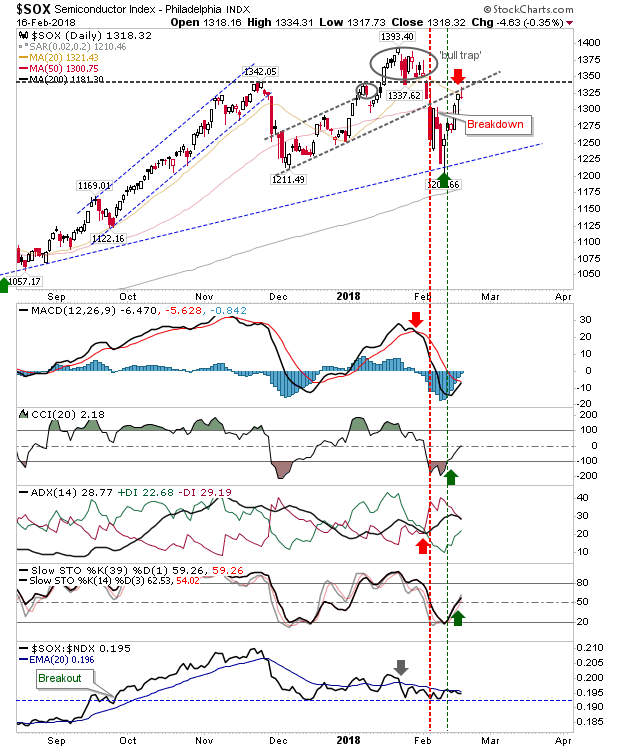
SOX Daily Chart


The S&P edged a close above the bullish mid-line in stochastics along with a 'buy' in On-Balance-Volume. However, the index also experienced a relative loss against Small Caps as it struggles to attract new buyers.
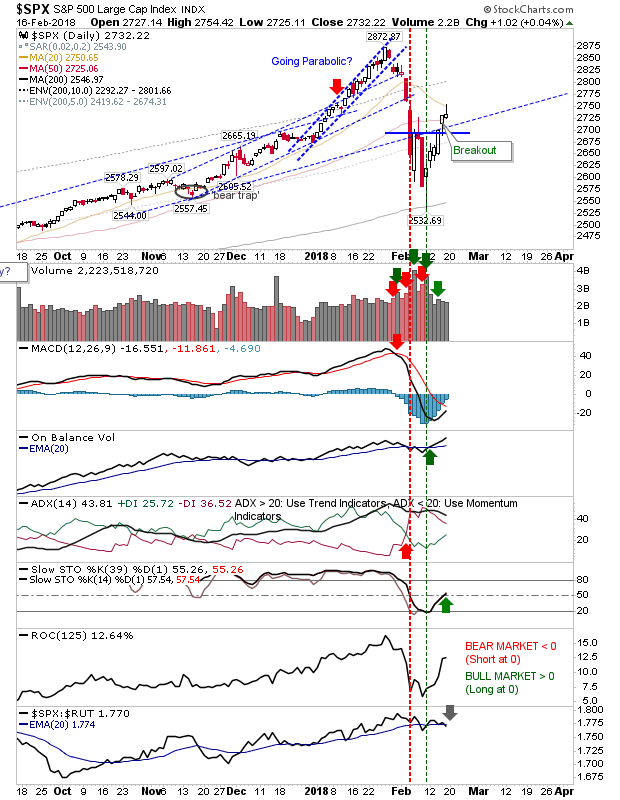
SPX Daily


The Russell 2000 pushed across the bullish mid-line and is close to a new MACD 'buy' trigger. While the Russell 2000 is outperforming against the S&P it's underperforming against the NASDAQ. However, a push above the 20-day MA may be enough for it to regain overall leadership.
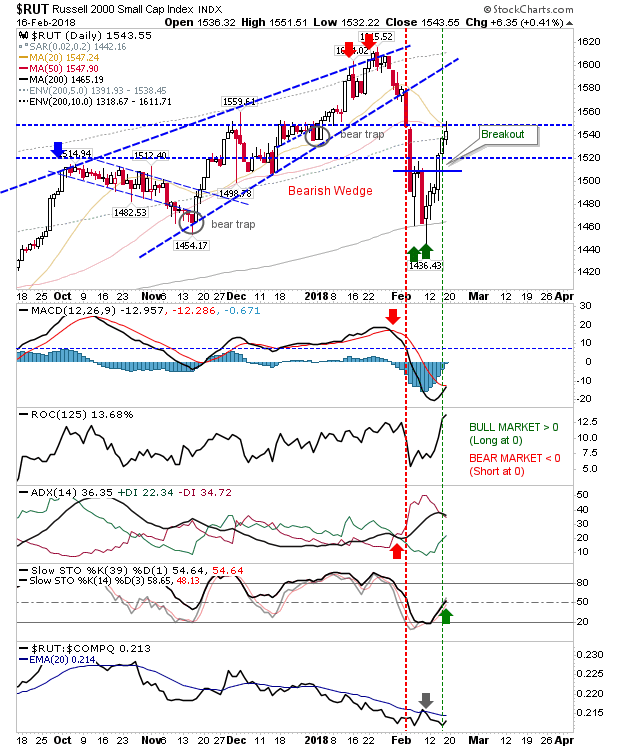
RUT Daily Chart


The NASDAQ may be the relative market leader but Tech indices closed lower where Large and Small Caps finished higher. A loss tomorrow will kick off the potential development of a new downward channel, marking a continued expansion of the consolidation.
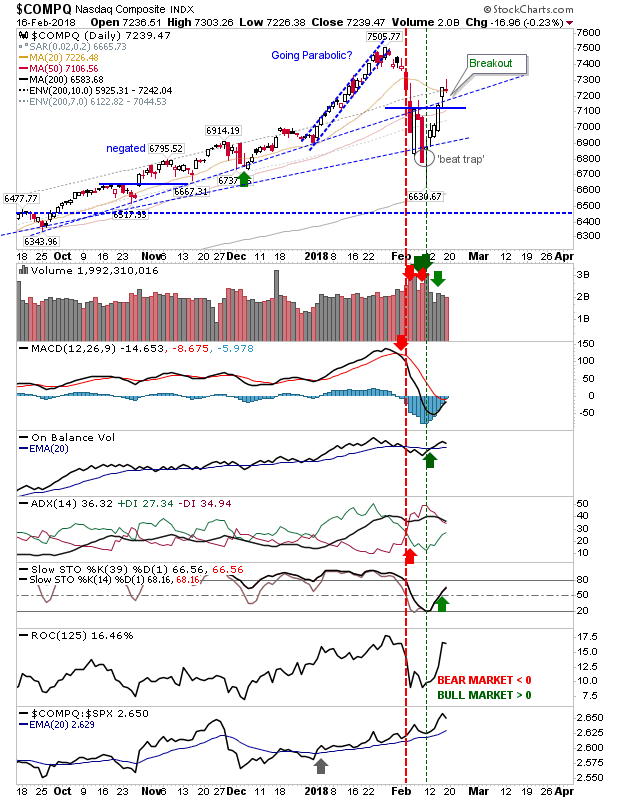
COMPQ Daily Chart


The longer term charts are more mixed. NASDAQ breadth metrics (Percentage of Stocks above the 50-day MA, 200-day MA, Summation Index and Bullish Percents) are caught in a bit of a no-man's land and are not oversold so it's neither a buy nor a sell.
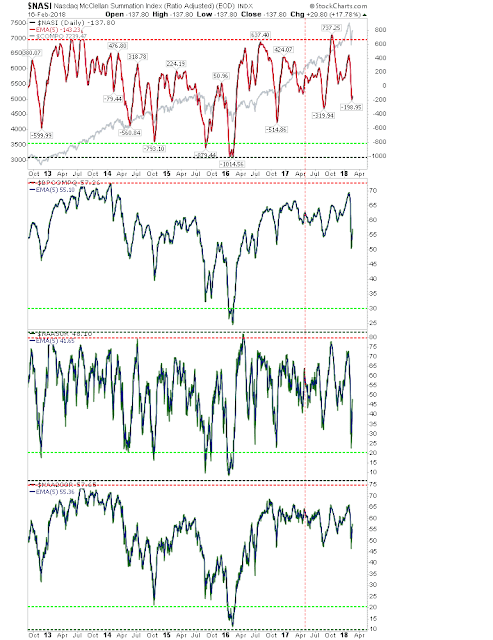
NASI Daily Chart


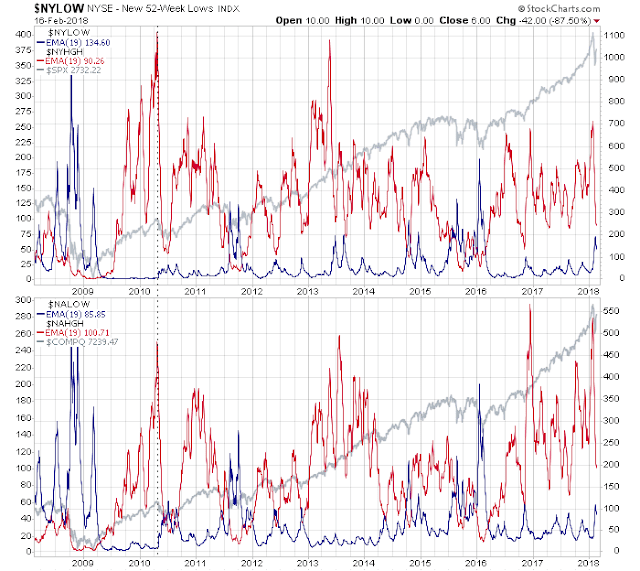
Similarly, the number of new 52-week highs and lows do not signify a top or a bottom but look to be favoring further weakness as 52-week lows show a gradual increase but as yet haven't spiked or gained above the number of new highs.
3rd party Ad. Not an offer or recommendation by Investing.com. See disclosure here or remove ads .

NYLOW Chart

The Dow Transports-Industrials ratio has again tagged its support neckline as it pressures the 'bear trap' following last weeks 'bull trap'. There is a big void down to 0.20s which is likely to coincide with a weakening of the economy (weak transports = weak demand for goods).
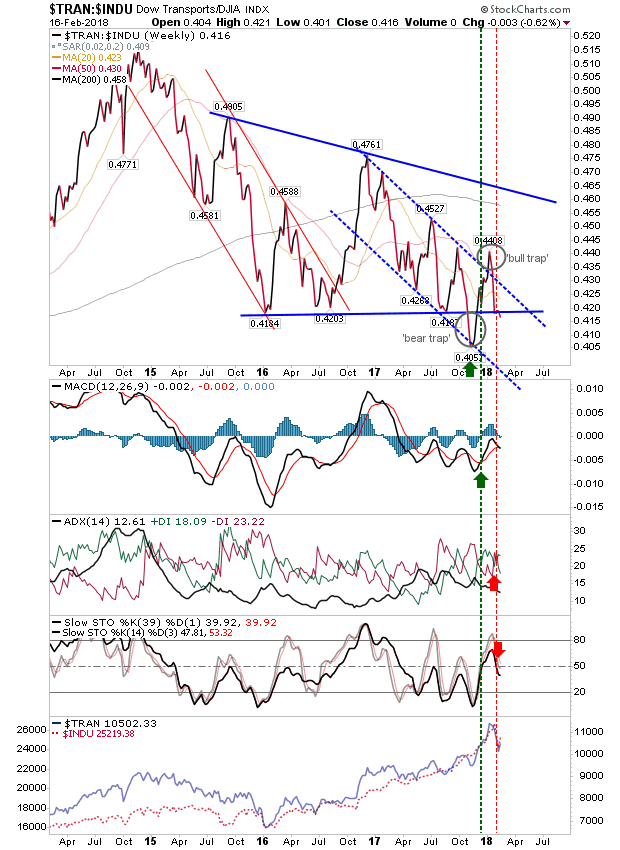
TRAN-INDU Daily Chart


The employment rate and Michigan consumer sentiment are also at levels more associated with a top than a bottom.
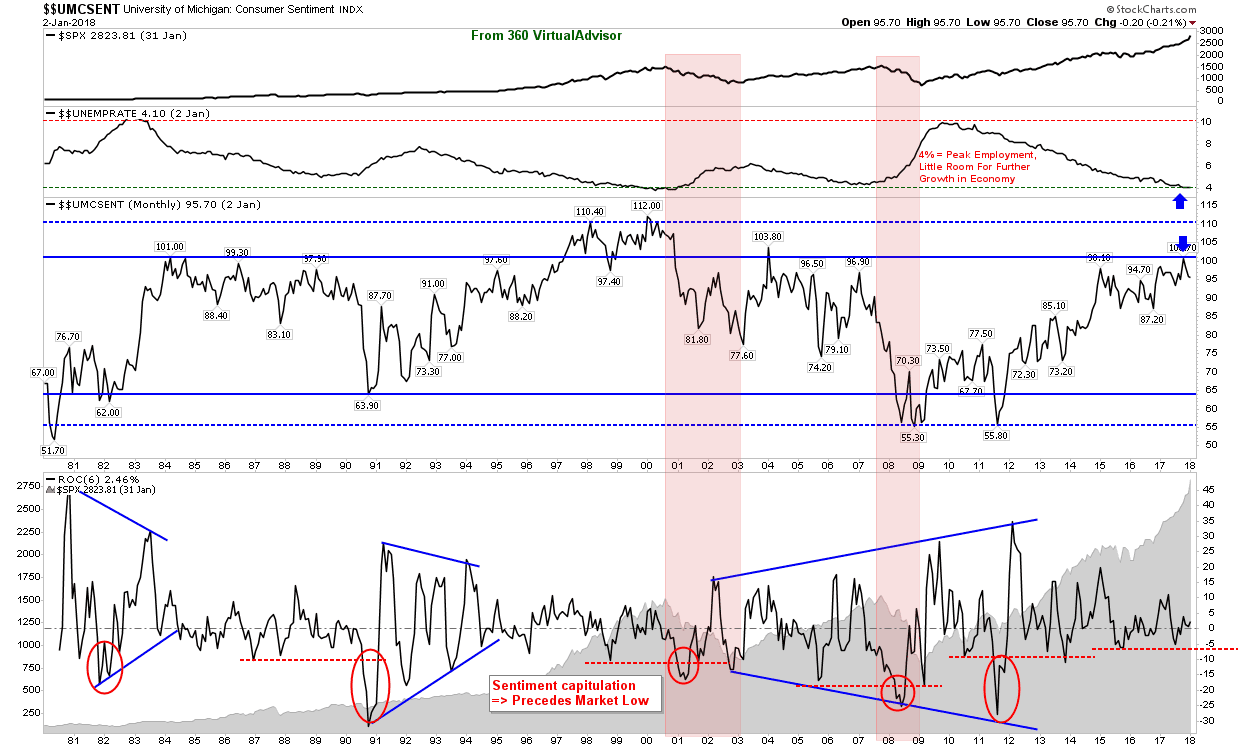
Employment:Sentiment Monthly 1980-2018


Going forward, bulls will need to be careful about committing to buying dips beyond anything with a short-term timeframe (> 6 months). The best strategy for long-term buyers is to wait for markets to come back into the zone last presented in February 2016 and highlighted in my tables below this article.

Latest comments

Risk Disclosure: Trading in financial instruments and/or cryptocurrencies involves high risks including the risk of losing some, or all, of your investment amount, and may not be suitable for all investors. Prices of cryptocurrencies are extremely volatile and may be affected by external factors such as financial, regulatory or political events. Trading on margin increases the financial risks.
Before deciding to trade in financial instrument or cryptocurrencies you should be fully informed of the risks and costs associated with trading the financial markets, carefully consider your investment objectives, level of experience, and risk appetite, and seek professional advice where needed.
Fusion Media would like to remind you that the data contained in this website is not necessarily real-time nor accurate. The data and prices on the website are not necessarily provided by any market or exchange, but may be provided by market makers, and so prices may not be accurate and may differ from the actual price at any given market, meaning prices are indicative and not appropriate for trading purposes. Fusion Media and any provider of the data contained in this website will not accept liability for any loss or damage as a result of your trading, or your reliance on the information contained within this website.
It is prohibited to use, store, reproduce, display, modify, transmit or distribute the data contained in this website without the explicit prior written permission of Fusion Media and/or the data provider. All intellectual property rights are reserved by the providers and/or the exchange providing the data contained in this website.
Fusion Media may be compensated by the advertisers that appear on the website, based on your interaction with the advertisements or advertisers.
© 2007-2024 - Fusion Media Limited. All Rights Reserved.