The war of words between the TiC (Tweeter-in-Chief) and the LiC (Lunatic-in-Chief) has little to do with the financial market’s intermediate-term fate. In the very short-term? Sure, man, machine, casino patron and Mom and Pop will fly in and out of stocks as the wind (and sentiment backdrop) blows. But before this standoff of the belligerent, the markets had set a course for changes come September or Q4 2017.
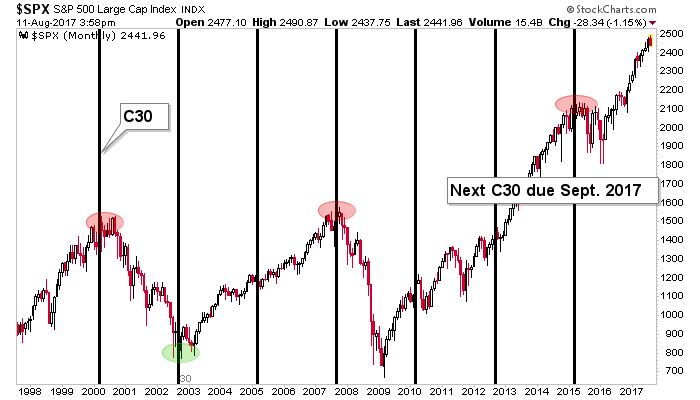
We have our 30 month cycle that often coincides with major tops or bottoms. Here’s the ‘C30’ chart once again, with the noise of the 12 month cycle, which caught the 2009 bottom, removed. The C30 caught the major tops in and around 2000 and 2007, and also caught the market top (that wasn’t) in 2015 and the bear market low in 2002.
Simple math states that C30 is batting 5 or 7 with respect to catching at least moderate turning points (2010 may not look like much on the monthly chart, but players in the midst of it were not feeling that way at the time). It’s an impressive batting average and it is fact, not bias or bearish wishful thinking.
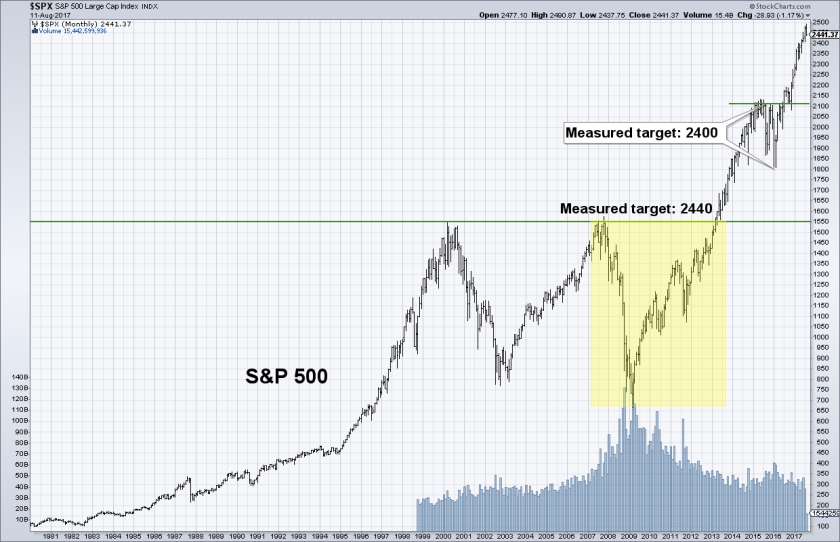
Another angle to view the S&P 500 is its big picture target acquisition. We laid out 2410 as the objective over a year ago in this detailed multi-market NFTRH update for subscribers (now public), which also noted the bullish Semiconductor sector as well as Emerging Markets (NYSE:EEM) and Asia (NASDAQ:AAXJ). I continue to tout these calls because when I write bearish it is important to quiet bull wise guys who may want to disregard the analysis as perma-bear stuff. Au contraire, good sir.
2410 was a measurement based on the 2015 decline but another, longer-term pattern had 2440 in its sights long before that. Both targets are long-since in the books with some overshoot to boot. So this is item number two (SPX table leg #2 that could get kicked out, if you will) corresponding with the potential for a market top; measured targets are not stop signs, but nor are these targets still out there laying in wait. They are no longer out there as a support to the bullish case.
Moving on, we have the Fed, which under Janet Yellen is ever so slowly withdrawing monetary policy that makes the term ‘over done’ sound like a massive understatement. This monetary policy was shoved down our throats and brutally enforced by the great Hero and his cohorts, who saved the world from the terrors of Armageddon ’08.
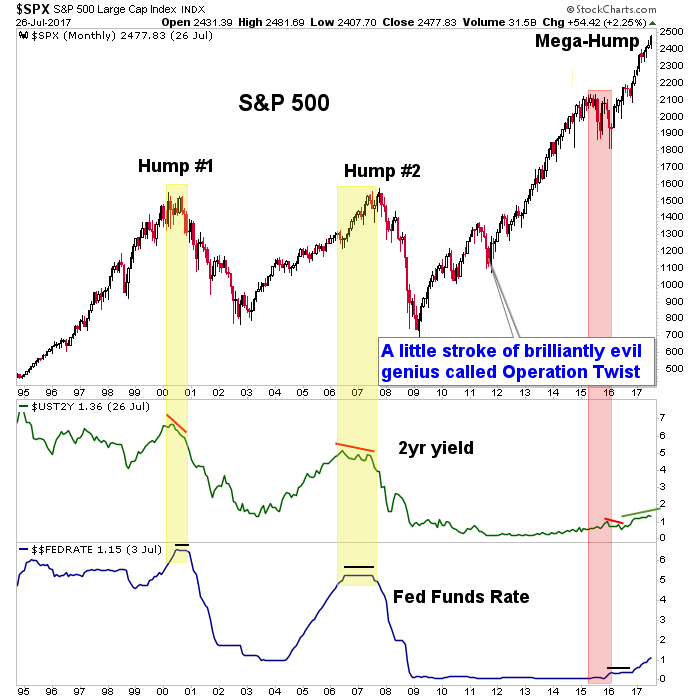
Except that it was the Hero’s predecessor who fomented the mess that the Hero ended up cleaning up through ingenious but highly abnormal, even experimental means. Now Yellen is attempting to slowly and methodically withdraw this policy. But with QEs 1, 2 and 3, Operation Twist and a 7 year run of ZIRP that went well beyond what the bond market called for (the 2yr yield began rising in early 2013), is slow and methodical going to get the job of reining it all in done?
So if a clock is ticking on the 30 month cycle for a market that has acquired its big picture targets, it is also ticking with respect to the relationship between 2 year Treasury yields (2yr) and the Fed Funds rate (FFR). Disregarding the historical absolute levels of the 2yr and the FFR, what matters is when the FFR catches up to the 2yr and then hangs flat while the 2yr fades. That is a Fed overshoot and based on 2000 and 2007, that is when the market cracks.
You can see this dynamic came into play in 2015-2016, but which came first, the chicken or the egg? In other words, the Brexit and global NIRP hysterias drove US yields down, including the 2yr, while the Fed just sat on the Funds rate for a while. They have now resumed their slow grind to tightening and the FFR is not far from the 2yr. But again, what will be important is if the 2yr starts fading now that the Fed is in tightening mode. Consider this dynamic, admittedly with a lot of moving parts, as the 3rd leg to be kicked out of the S&P 500 and US stock market.
There are many other components that make up a 4th and final leg to be kicked out from under the market, but a major one is the inverse nature of the US dollar and stocks, post-election. This includes many global markets like the aforementioned EMs and Asia.
Here is the chart that clearly shows a negative correlation between USD and SPX. If we are right to expect a bounce, we are also right to expect upcoming pressure on the stock market. The global growth game is after all played on a field littered with compromised currencies.
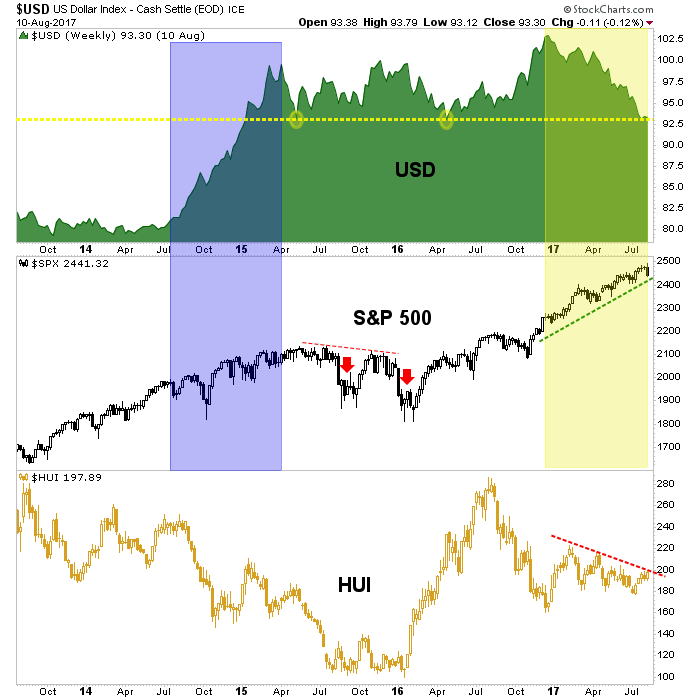
Moving to gold, a majority will expect gold to get hurt more than most assets because they see gold as the anti-dollar. It got hammered relative to stocks but is nominally positive since the election and the gold miners, as represented by the HUI index, has actually declined during the US dollar’s decline. That is a bit misleading since there have been a bunch of companies handily out performing the index, which we have seen as a positive divergence for the sector by the quality ‘1st movers’.
If there were established and proven laws of market physics I’d bet one of them would be that ‘if X runs in relative positive correlation to Y and Z runs in relative negative correlation to Y, then X will out perform Z if Y changes trend and rises’. In this case X=gold miners, Y=USD and Z = S&P 500.
So I again flog you with the Macrocosm, which shows the real fundamentals for the gold sector and tunes down the crap about the India/China “love trade” and inflation obsessions (with respect to gold) and puts the biggest fundamental planets right out front (Confidence and Yield Spreads should be a bit larger). But given the mania going on in stocks, that big planet in front is right where it should be.
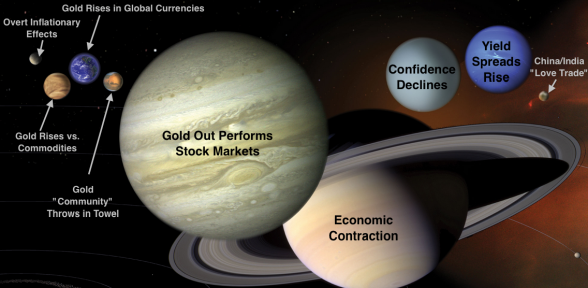
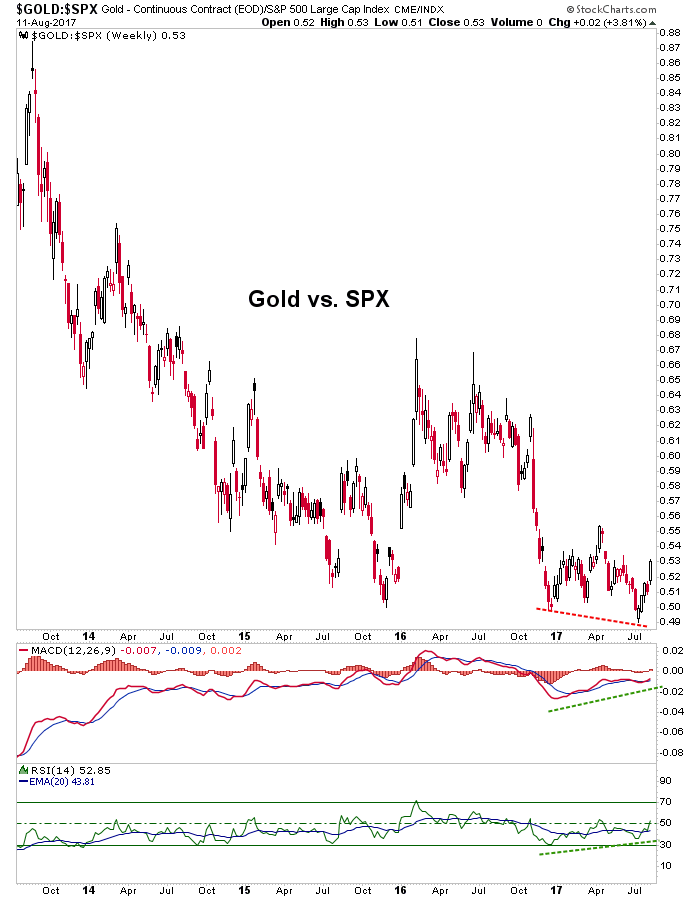
So by extension, the implication of the stock market’s wobbly legged table would be a firming gold sector, which is after all, counter-cyclical. Patience my friends. Rome was not built in a day, nor will the next gold bull market be. But suffice it to say, if I had to boil it down to just one chart it would be this one. The 2017 momentum divergence to the negative price of Gold/SPX must resolve in a new uptrend if the gold sector is going to have its day.
So I ask you, do the the potential legs to get kicked out from under the S&P 500 look wobbly to you?
