- Futures markedly higher on Trump's and Xi Jinping's upbeat remarks
- European shares mostly flat
- Oil rebounds from Friday's fall, confirming instability
- The US ISM manufacturing PMI is due on Friday.
- Fed Chair Powell will speak alongside predecessors Janet Yellen and Ben Bernanke at the annual meeting of the American Economic Association on Friday. Atlanta Fed President Raphael Bostic will also join a panel on long-run macroeconomic performance.
- Futures on the S&P 500 rose 0.8 percent, to the highest level in almost two weeks.
- The MSCI All-Country World Index climbed 0.1 percent to the highest level in more than a week.
- The MSCI Emerging Market Index gained 0.4 percent to the highest level in more than a week.
- The Dollar Index fell less than 0.1 percent to 96.35, for the third day and an accumulated 0.35 percent, to the lowest level since December 21.
- The euro climbed less than 0.05 percent to $1.1445, the strongest level in more than a week.
- The Japanese yen edged less than 0.05 percent higher to 110.23 per dollar, the strongest level in 19 weeks.
- The British pound gained 0.3 percent to $1.2735, the strongest level in more than three weeks.
- The MSCI Emerging Markets Currency Index gained 0.1 percent to the highest level in almost four weeks.
- The yield on 10-year Treasurys climbed one basis point to 2.72 percent.
- Britain’s 10-year yield slipped four basis points to 1.269 percent, the biggest fall in a week.
- The Bloomberg Commodity Index slid less than 0.05 percent to the lowest level in a week.
- LME copper gained 0.4 percent to $6,023.00 per metric ton, the highest level in two weeks.
- Gold increased 0.1 percent to $1,281.53 an ounce, the highest level in almost seven months.
Key Events
Futures on the S&P 500, Dow and NASDAQ 100 rallied this morning, perhaps a last-ditch attempt by US equities to end the worst year of the current, long-standing equity bull market on an upbeat note. Chinese President Xi Jinping's reported confidence that China and the US can meet halfway and seal an agreement "as early as possible" added to Trump's messages, on Saturday, of "big progress" on trade to shore up market sentiment.
The STOXX Europe 600 was up for a second day buoyed by miners and retailer shares in the early session, though it later eased to neutral levels. The pan-European benchmark is still set for a 13 percent loss on the year—the worst annual performance for the benchmark since 2008.
In the earlier Asian session, most regional exchanges were closed for the holiday, including China, Japan and South Korea. Xi Jinping's comments helped Hong Kong’s Hang Seng gain 1.34 percent, though the advance could be the result of traders flocking to the only open market in the region.
Global Financial Affairs
On Friday, US equities paused their upward trajectory after a two-day rally that included the biggest daily reversal since 2010; clearly investors were not willing to take on yet more risk over the weekend. Last week's shortened holiday-week started with the worst Christmas Eve session ever, which was followed, right after Christmas, by the largest daily advance since the Great Recession. Holiday trading is now likely to get thinner, as trader indecision hampers activity.
The S&P 500 dropped 0.12 percent to close the week, though it still managed to hold onto its first weekly gain of the month.
The Dow Jones Industrial Average slipped 0.33 percent lower on last week's final day of trade. The NASDAQ Composite slowed, reaching a standstill, closing 0.08 percent higher. The Russell 2000 outperformed, climbing 0.38 percent.

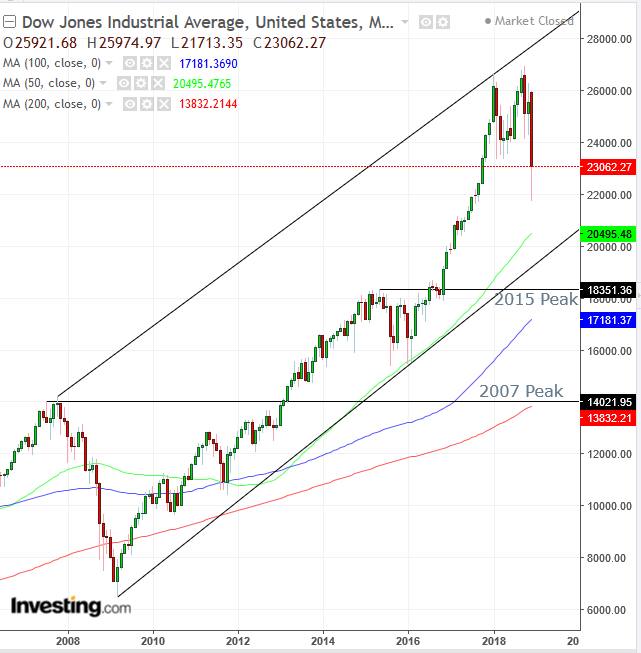
The Dow has reached the top of its rising channel for the first time since 2007, when shares lost half their value in 18 months. The bottom of the channel is at 20,000, another 13 percent drop, bringing the total decline from its October peak to 25 percent. Note the major MAs: the 50-month MA, which points at the technical pressure point of the channel bottom; the 100-month MA, which marks the 2015 peak; and, finally, the 200-month MA, which draws the line in the sand for the 2007 peak.

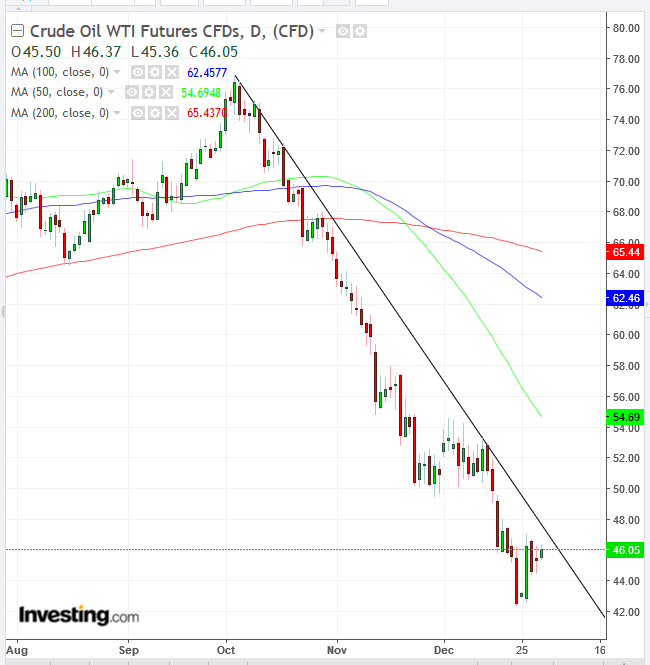
Meanwhile, WTI slipped from its high of the day on Friday as it neared the downtrend line from early October. The oil market was caught in a dual dynamic this year with cause and effect becoming blurred. At first, rising US supply compounded by lowered demand due to a pessimistic global growth outlook drove WTI lower. The drastic declines pushed down market averages, leaving oil prices mired in their steepest quarterly slump since 2014.
Technically, the current downtrend makes further selloffs more likely than a rebound. However, WTI is edging higher today, confirming the roller coaster pattern it has recently exhibited.
Political and geopolitical risk—ranging from the UK’s convoluted exit process from the European Union to the US-China trade dispute to the ongoing showdown in the US between Trump and Congress over the budget—will continue to cloud market sentiment in the new year. The political landscape in the US is also unsettling investors, following departures of senior officials and Trump’s repeated criticism of Fed Chairman Jerome Powell.
Up Ahead
Market Moves
Stocks
Currencies
Bonds
Commodities
