- Fundamentals and technicals support a bull market after a take-profit correction
- Dow Jones outperforms the S&P 500 and the Russell 2000 underperforms, as investors overcome trade fears
- US dollar struggles to remain within an uptrend, Morgan Stanley calls a top
Major US stocks mostly ended the week higher as companies reported positive earnings, but Friday’s decline revealed that traders were not willing to remain exposed over the weekend, signaling a potential short-term, profit-taking correction.
Going forward, the outlook for economic growth and earnings is still favorable. The question remains whether macro and micro growth will be enough to offset concerns about trade and interest rates. We maintain our bullish outlook, as the trend remains up. Investors have overall demonstrated confidence despite the macro threat, although Friday’s selloff signals caution.
S&P 500 Weekly Chart

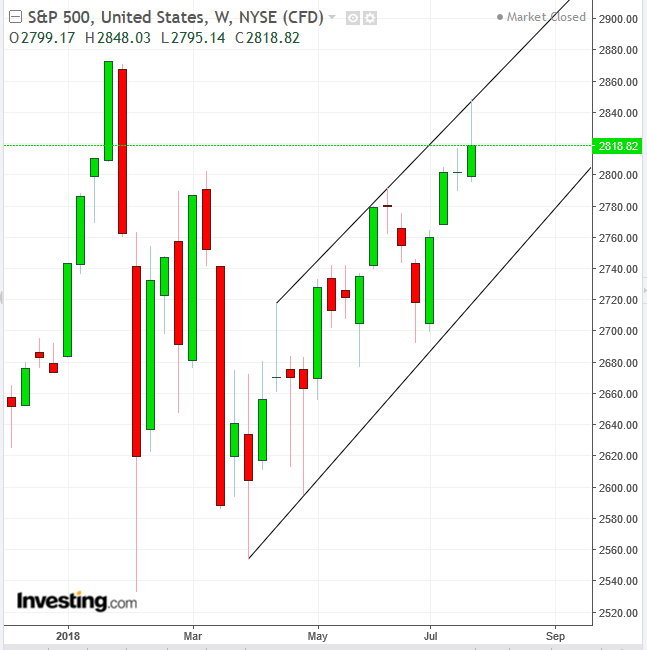
The S&P 500 fell 0.66 % Friday with communication services (-1.9%) and technology (-1.71%), dragged down by Twitter Inc (NYSE:TWTR) and Intel (NASDAQ:INTC). Twitter joined Facebook (NASDAQ:FB) in disappointing on user growth and weak guidance. Twitter closed over 20% lower Friday, even as the 17 cents EPS met expectations and the $711 million revenue beat the $697.9 million forecast. Analysts focused on the 335 million monthly active users, which missed the 338.5 million estimated.
For the week, the S&P 500 rose 0.61%, with six sectors rising roughly between 1% and 2.3% offsetting a 3.85 % plunge by communication services and a 0.96% retreat by technology. The most trade-sensitive sectors, industrials, and materials jumped 2.11% and 1.73% respectively in a sign that traders shrugged off trade concerns.
Technically, Friday’s selloff completed a bearish engulfing pattern, whose first candle formed a shooting star. On a weekly basis, the benchmark gave up more than half of its advance, forming a shooting star, after penetrating the top of a rising channel since mid-April. This candle indicates that supply absorbed demand at these levels and sellers dropped their asking prices to find willing buyers. The fact that this coincided with a failed attempt to breakout topside of the channel reinforces its bearish sentiment. This fits with the technical map, after the 5.8 % rise from the channel bottom, June 28 through July 25.
The Dow Jones retreated Friday 0.3%, less than half of that of the S&P 500. The oldest stock gauge advanced 1.57% for the week. This underlines that investors put their concerns over trade on the backburner, as mega caps are more sensitive to exports and yet have outperformed.
The Nasdaq Composite dropped 1.46% Friday and 1.06% for the week. The tech-heavy benchmark underperformed the other two indices, after having outperformed all major gauges in the last rally. The Nasdaq began its climb April 4 and had increased 16.5% in value through July 25, making a bigger case for profit-taking than the other gauges.
The Russell 2000 plunged Friday 1.83% and 1.95% for the week, performing the worst among the major indices on both measures for two reasons. One, like the Nasdaq, it outperformed the Dow and the S&P, rising 15.3% since April 2. Two, in a mirror image to the Dow Jones, its decline supports the view that traders have overcome their reservations about the global trade risk during this period.
While the surprise Trump-Juncker zero-tariff agreement pushed stocks higher Wednesday, the fact is that they have been climbing since Monday. In other words, it’s not only that a lower risk of a trade war with Europe boosted stocks, but investors are also disregarding it as bonafide market risk, as long as the economy keeps expanding and companies keep earning.
GDP increased 4.1% in the second quarter, the best pace in 4 years. Strong consumer and business spending, as well as a surge in exports ahead of retaliatory tariffs from China, helped drive economic growth. The question is will the trade dispute with China turn it all around? On the macro side, the economy is chugging along; on the fundamental side, companies are overall reporting solid earnings, and on the technical side, the trend is up. We won't second guess this trifecta, but we’ll ride it out until it slows down.
US Dollar Index Daily Chart

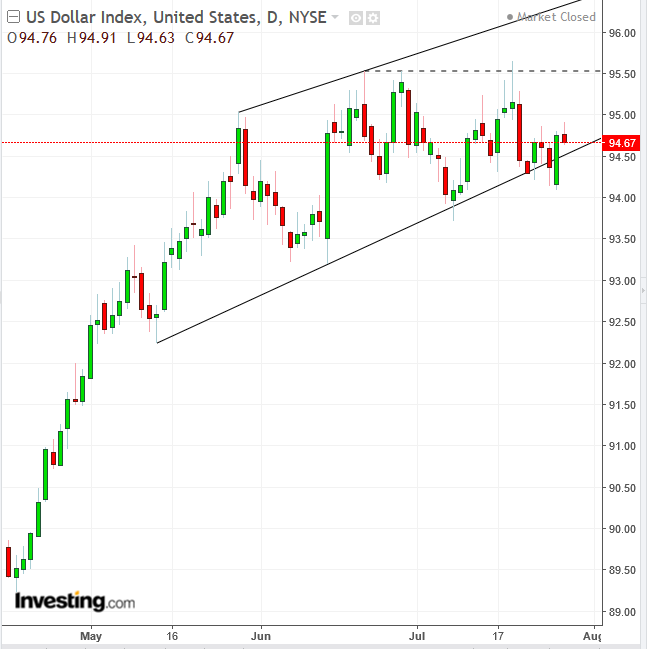
Currency traders, on the other hand, remain wary of the trade war risk, as evident by Friday’s decline, even after the strongest growth to the US economy since the third quarter of 2014. The dollar has failed twice to rise above its June 21 peak and has been fighting to remain above its uptrend line since May 14. Should the greenback fail to climb above the 95.50 level but rather fall below the uptrend line, it would increase the odds of a reversal, which require two descending peaks and troughs.
Morgan Stanley now says that the dollar is peaking after President Donald Trump accused China and the EU of currency manipulations, a weaker US economic survey indicator, Chinese economic stimulus and potential tweaks to the BOJ policy.
WTI Weekly Chart

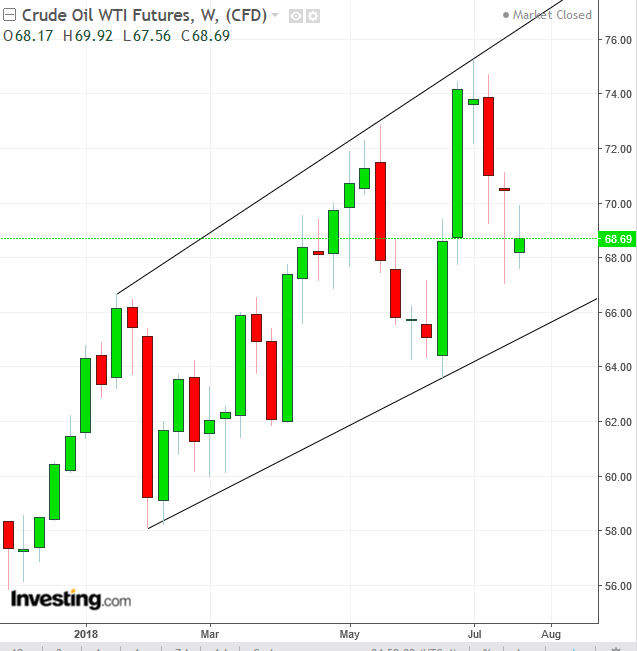
Oil traders have also been mindful of the trade risk to economic growth. Prices have been falling even when inventories declined last Wednesday, typically a fundamental reason to drive prices up. Analysts are now focusing on sparse investments on oil projects, with some forecasting a spike above $100 by the end of next year. Technically, the price of oil has been traded within a rising channel.
Week Ahead – All Times are in EDT
Monday
5:00 – Eurozone Business Climate (July): forecast to fall to 1.35 from 1.39.
8:00 – German CPI (July, preliminary): expected to remain steady at 2.1 % YoY and rise to 0.4 % from 0.1 % MoM.
10:00– US Pending Home Sales (June): forecast to rise to 0.4 % from -0.5 %.
19:30 – Japan Unemployment (June): rate expected to rise to 2.3% from 2.2%.
21:00 – China Manufacturing, Non-Manufacturing PMIs (July): mfg PMI to fall to 51.4 from 51.5, while the non-mfg PMI to remain flat at 55.
23:00– BoJ Rate Decision: expected to leave rates at -0.10 %.
Tuesday
1:00– Japan Household Confidence (July): forecast to rise to 43.9 from 43.7.
3:55 – German Unemployment (July): Unemployment rate to hold at 5.2%.
5:00 – Eurozone CPI (July, flash), Employment (June), GDP (Q2, flash): CPI to be 2% YoY, unchanged from last month, and core CPI to rise to 1.0% YoY from 0.9%. Unemployment rate to rise to 8.3% from 8.4%, and GDP to drop to 2.2% from 2.5% YoY and to remain at 0.4% QoQ.
8:30 – US Personal Income and Spending (June): income and spending to both be 0.4%, from 0.4% and 0.2% respectively last month. PCE prices, the Fed's preferred measure of inflation to fall to 0.1% from 0.2% MoM.
9:45 – Chicago PMI (July): forecast to fall to 61.9 from 64.1.
10:00– US Conference Board Consumer Confidence (July): expected to rise to 126.5 from 126.4.
Wednesday
4:30 – UK Manufacturing PMI (July): forecast to fall to 54.2 from 54.4.
8:15 – US ADP Employment Report (July): 186,000 jobs expected to have been created, from 177,000.
10:00 – US ISM Manufacturing PMI (July): forecast to fall to 59.4 from 60.2.
10:30 – US EIA Crude Inventories: expected to rise to -0.189M, from -6.1M
13:00 – FOMC Rate Decision: no change expected, and with no press conference market reaction may well be muted.
Thursday
4:30 – UK Construction PMI (July): expected to fall to 52.9 from 53.1.
7:00– BoE Rate Decision: Increase in interest rates to 0.75% from 0.5% is expected, but given recent weakness in UK data the bank may yet delay once again.
8:30 – US initial jobless claims: expected to rise to 220k from 217k.
19:50 – BoJ Minutes: While analysts debate whether the central bank will adjust its target of keeping 10-Year yields around zero %, its steady reduction in purchases of longer-maturity debt and more expensive overseas hedging costs mean Japanese funds are already contemplating repatriating its capital, boosting demand for the yen. Bringing money home has been a key reason for the yen’s haven status.
Friday
5:00 – Eurozone Retail Sales (June): expected to fall to 1.3% YoY from 1.4%.
8:30 – Canada Trade Balance (June): expected to see deficit narrow to C$2.30 billion from C$2.77 billion.
8:30 – US Nonfarm Payrolls (July): payrolls forecast to fall to 190K from 213K, while the unemployment rate falls to 3.9% from 4%. Average hourly earnings to rise 0.3% from 0.2%MoM.
10:00 – US ISM Non-Manufacturing PMI (July): forecast to fall to 58.7 from 59.1.
