Early Asian rally reverses on China-US trade retaliation
US futures signal market to open lower on renewed trade war headwinds
Fundamentals continue to support equities though technicals reveal weakness
- Bitcoin rebounds; rallies past $7K
US manufacturing PMI and ISM manufacturing data is due Monday.
The Reserve Bank of Australia's April monetary policy decision is due out Tuesday.
- Music streaming service Spotify (NYSE:SPOT) begins trading on Tuesday, via an unusual direct IPO listing.
The New York Fed debuts the Secured Overnight Financing Rate on Tuesday.
The Reserve Bank of India April policy decision due out Thursday.
US employment data due to be released on Friday
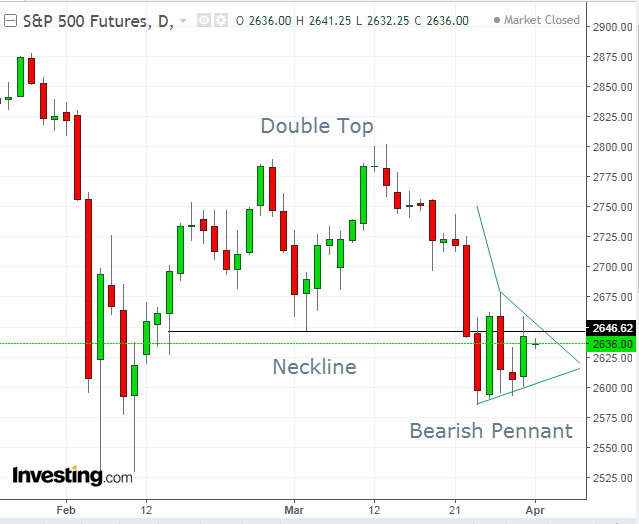
Futures on the S&P 500 fell 0.3 percent.
The Shanghai Composite dipped 0.2 percent.
Japan's TOPIX fell 0.4 percent.
The MSCI Emerging Market Index gained 0.3 percent.
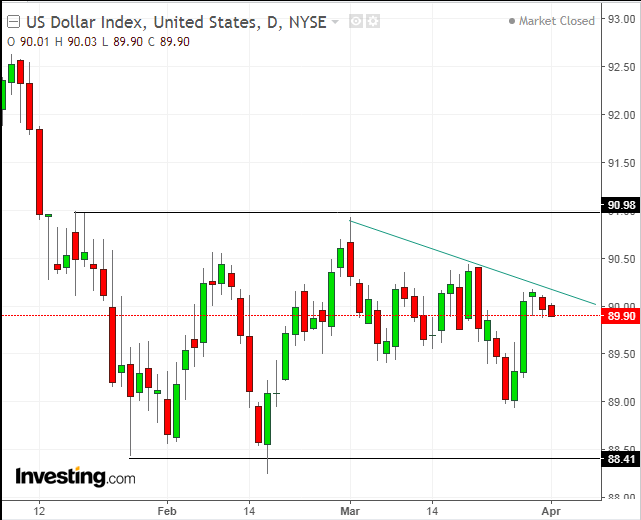
The Dollar Index fell for a second day, by less than 0.10 percent to 89.90, after Friday's confirmation of a Hanging Man at the upper region of a consolidatoin since mid-January and the downtrend line since March 1.
The euro dipped less than 0.05 percent to $1.2323.
The British pound advanced 0.3 percent to $1.4053, the first advance in a week.
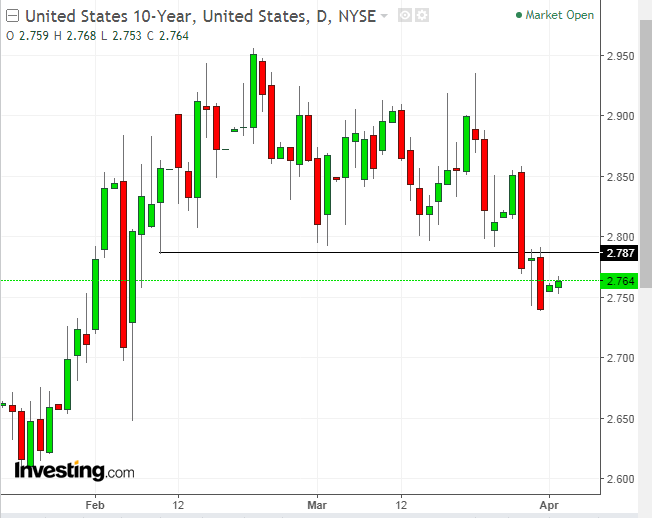
The yield on 10-year Treasurys gained two basis points to 2.76 percent, the largest gain in a week.
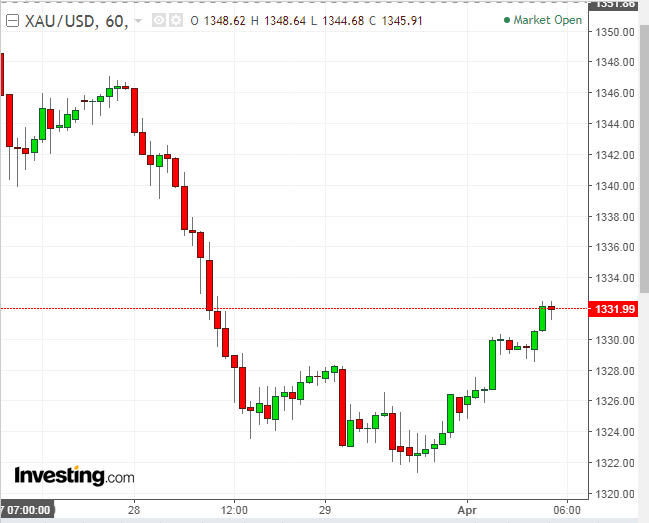
Gold increased 0.5 percent to $1,331.80 an ounce, the biggest leap in more than a week.
WTI crude increased 0.3 percent to $65.13 a barrel.
Key Events
Stocks in the Asian session slipped lower this morning, losing steam from an earlier rally led by Chinese indices. US futures are also on the decline.
New rules allowing Chinese tech firms to return to the country's mainland markets had earlier boosted shares, in part by offsetting the negative impact of the country's ongoing trade tensions with the US.
The Asian session's broader decline follows China's response to US President Donald Trump's tariffs, levied on imported steel and aluminum. Early Monday, China's finance ministry unveiled their own import duties—on meat, fruit and other US exports, in an escalation of tit-for-tat measures that may undo the strong US equity rallies seen last Monday and Thursday.
All of this was accompanied by low volume, as many markets—including Hong Kong, Australia, the UK, most of Europe and Canada—are closed today in observance of the Easter holiday.
Stocks had gained ground last week on hopes that diplomatic negotiations between the two countries would replace any political battles. However, today's Chinese retaliatory measures have US markets starting the new quarter on a downleg.
S&P 500 Futures are sliding below neutral levels, backing that hypothesis.
Global Financial Affairs
The second quarter of 2018 has kicked off with stock traders on the defensive, after a rocky first quarter that abruptly halted a 9-quarter winning streak for shares listed on the S&P 500 and the Dow. For the latter, 30-component mega cap index it was the longest rally in 20 years.
At the start of 2018, investors were hit by an array of risks that hadn't occurred in such a synchronized manner since the Great Recession. These included an increased outlook for faster interest rates hikes, trade war jitters and mounting worries of a regulatory crack-down on big tech firms in the aftermath of the scandal surrounding Facebook's (NASDAQ:FB) data breach.
US labor market data will be the focus this week when Friday's Nonfarm Payrolls release for March is scheduled to occur. Unemployment is expected to fall to its lowest level since 2000. Traders have also been awaiting further details on US plans for tariffs on Chinese imports, so today's developments are likely to have heightened their focus.
Geopolitical jitters aside, an argument for remaining bullish comes from the fact that interest rates are still low by historical standards. This means equities are still attractive, especially when the global growth story remains intact.
On the other hand, yields on the 10-year US Treasury hit a top.
As well, gold posted its longest quarterly winning streak since 2011. This raises a red flag that investors are rotating out of equities and into the security of government bonds with gold as a safe haven for their capital.
The Japanese yen held steady as traders digested a local poll showing improved support for Prime Minister Shinzo Abe’s cabinet. South Korea's won surged to its strongest level against the dollar in over three years as long-standing political tensions in the region showed further signs of easing.
The euro was little changed, while the pound pushed higher.
Bitcoin rebounded above $7,000, heading toward the top of a consolidation that started on Friday.
WTI crude oil climbed past $65 per barrel after bagging a third straight quarterly gain.
Up Ahead
Market Moves
Stocks
Currencies

Bonds
Commodities


