The recent positive news on the vaccine front as reported by Pfizer (NYSE:PFE), BioNTech (NASDAQ:BNTX) and Moderna (NASDAQ:MRNA) has brought cheer to several sectors including energy, travel and financial. On the commodity front, oil has also been getting plenty of investor attention.
Fortunes of oil companies are typically linked to the price of crude oil, which is affected by demand and supply realities. When analysts discuss crude oil, they usually look at prices of the global benchmark Brent crude and the US benchmark, West Texas Intermediate WTI.
Both started 2020 around $60 per barrel, only to plummet toward $20 by April. Brent is now shy of $44 and WTI is around $41.5. Investors wonder whether a further opening up of global economies could also mean pent up oil demand in the coming months.
So far in the year, the Dow Jones Oil & Gas index is down about 39%. Yet, in November, it is up around 20%.
We previously looked at several oil stocks and exchange-traded funds (ETFs), including UK-based oil major, BP (NYSE:BP), the Energy Select Sector SPDR Fund (NYSE:XLE), and the United States Oil Fund (NYSE:USO).
Today's article builds upon that discussion and looks at two other oil and energy ETFs that could benefit if there is an uptrend in energy prices, including oil.
1.Vanguard Energy Index Fund ETF Shares
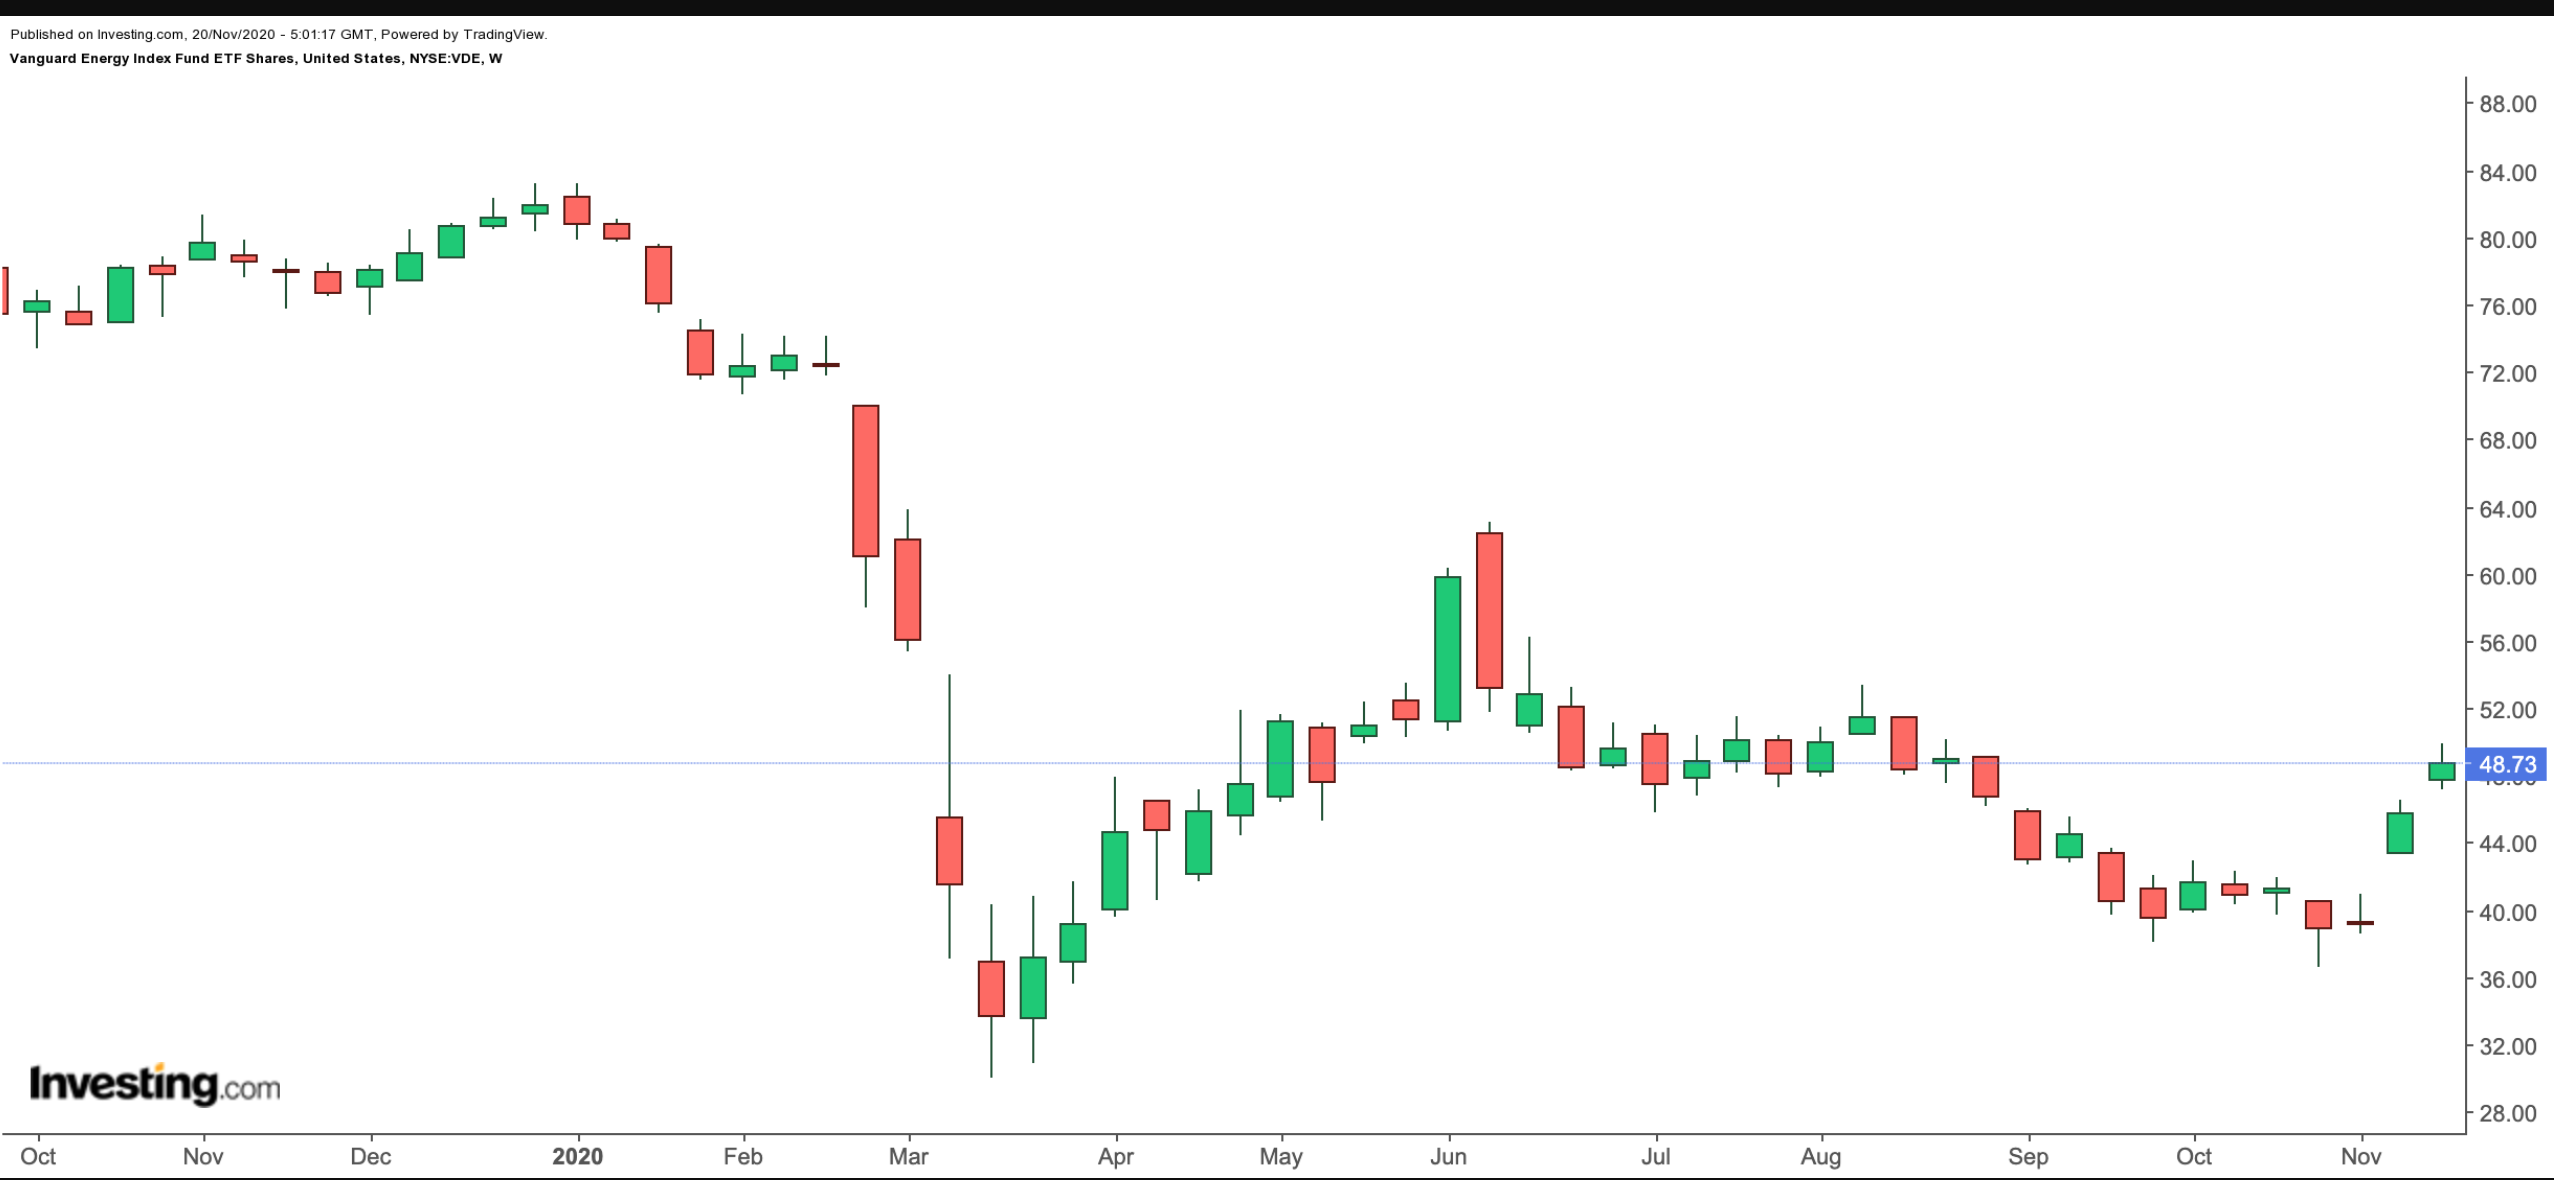
Current Price: $48.74
52-Week Range: $30.03 - $83.27
Dividend Yield: 5.47%
Expense Ratio: 0.10%
The Vanguard Vanguard Energy Index Fund (NYSE:VDE) provides exposure to businesses that focus on the exploration and production of energy products, including oil, natural gas, and coal. The fund started trading in 2004 and has net assets of $2.7 billion.

VDE, which has 115 holdings, tracks the Spliced US IMI Energy 25/50 Index. 70.3% of the holdings are in the top ten shares. Energy giant Exxon Mobil (NYSE:XOM), Chevron (NYSE:CVX), which focuses on upstream and downstream operations, exploration and production firm ConocoPhillips (NYSE:COP) and energy infrastructure groups Kinder Morgan (NYSE:KMI) and Williams (NYSE:WMB) lead the firms in the fund.
As far as industries are concerned, funds are distributed among Integrated Oil & Gas (44.5%), Oil & Gas Exploration & Production (21.3%) and Oil & Gas Storage & Transportation (13.5%).
Year-to-date, VDE is down 41%. Yet, so far in November, the fund has gone up over 20%. Trailing P/E and P/B ratios are 31.6 and 0.9, respectively. Those investors who believe that oil supply no longer outweighs demand could consider building a position in the fund, especially if there is a short-term price decline toward $45. Buying oil ETFs may require patience but could be appropriate for a number of long-term portfolios.
2.VanEck Vectors Oil Refiners ETF
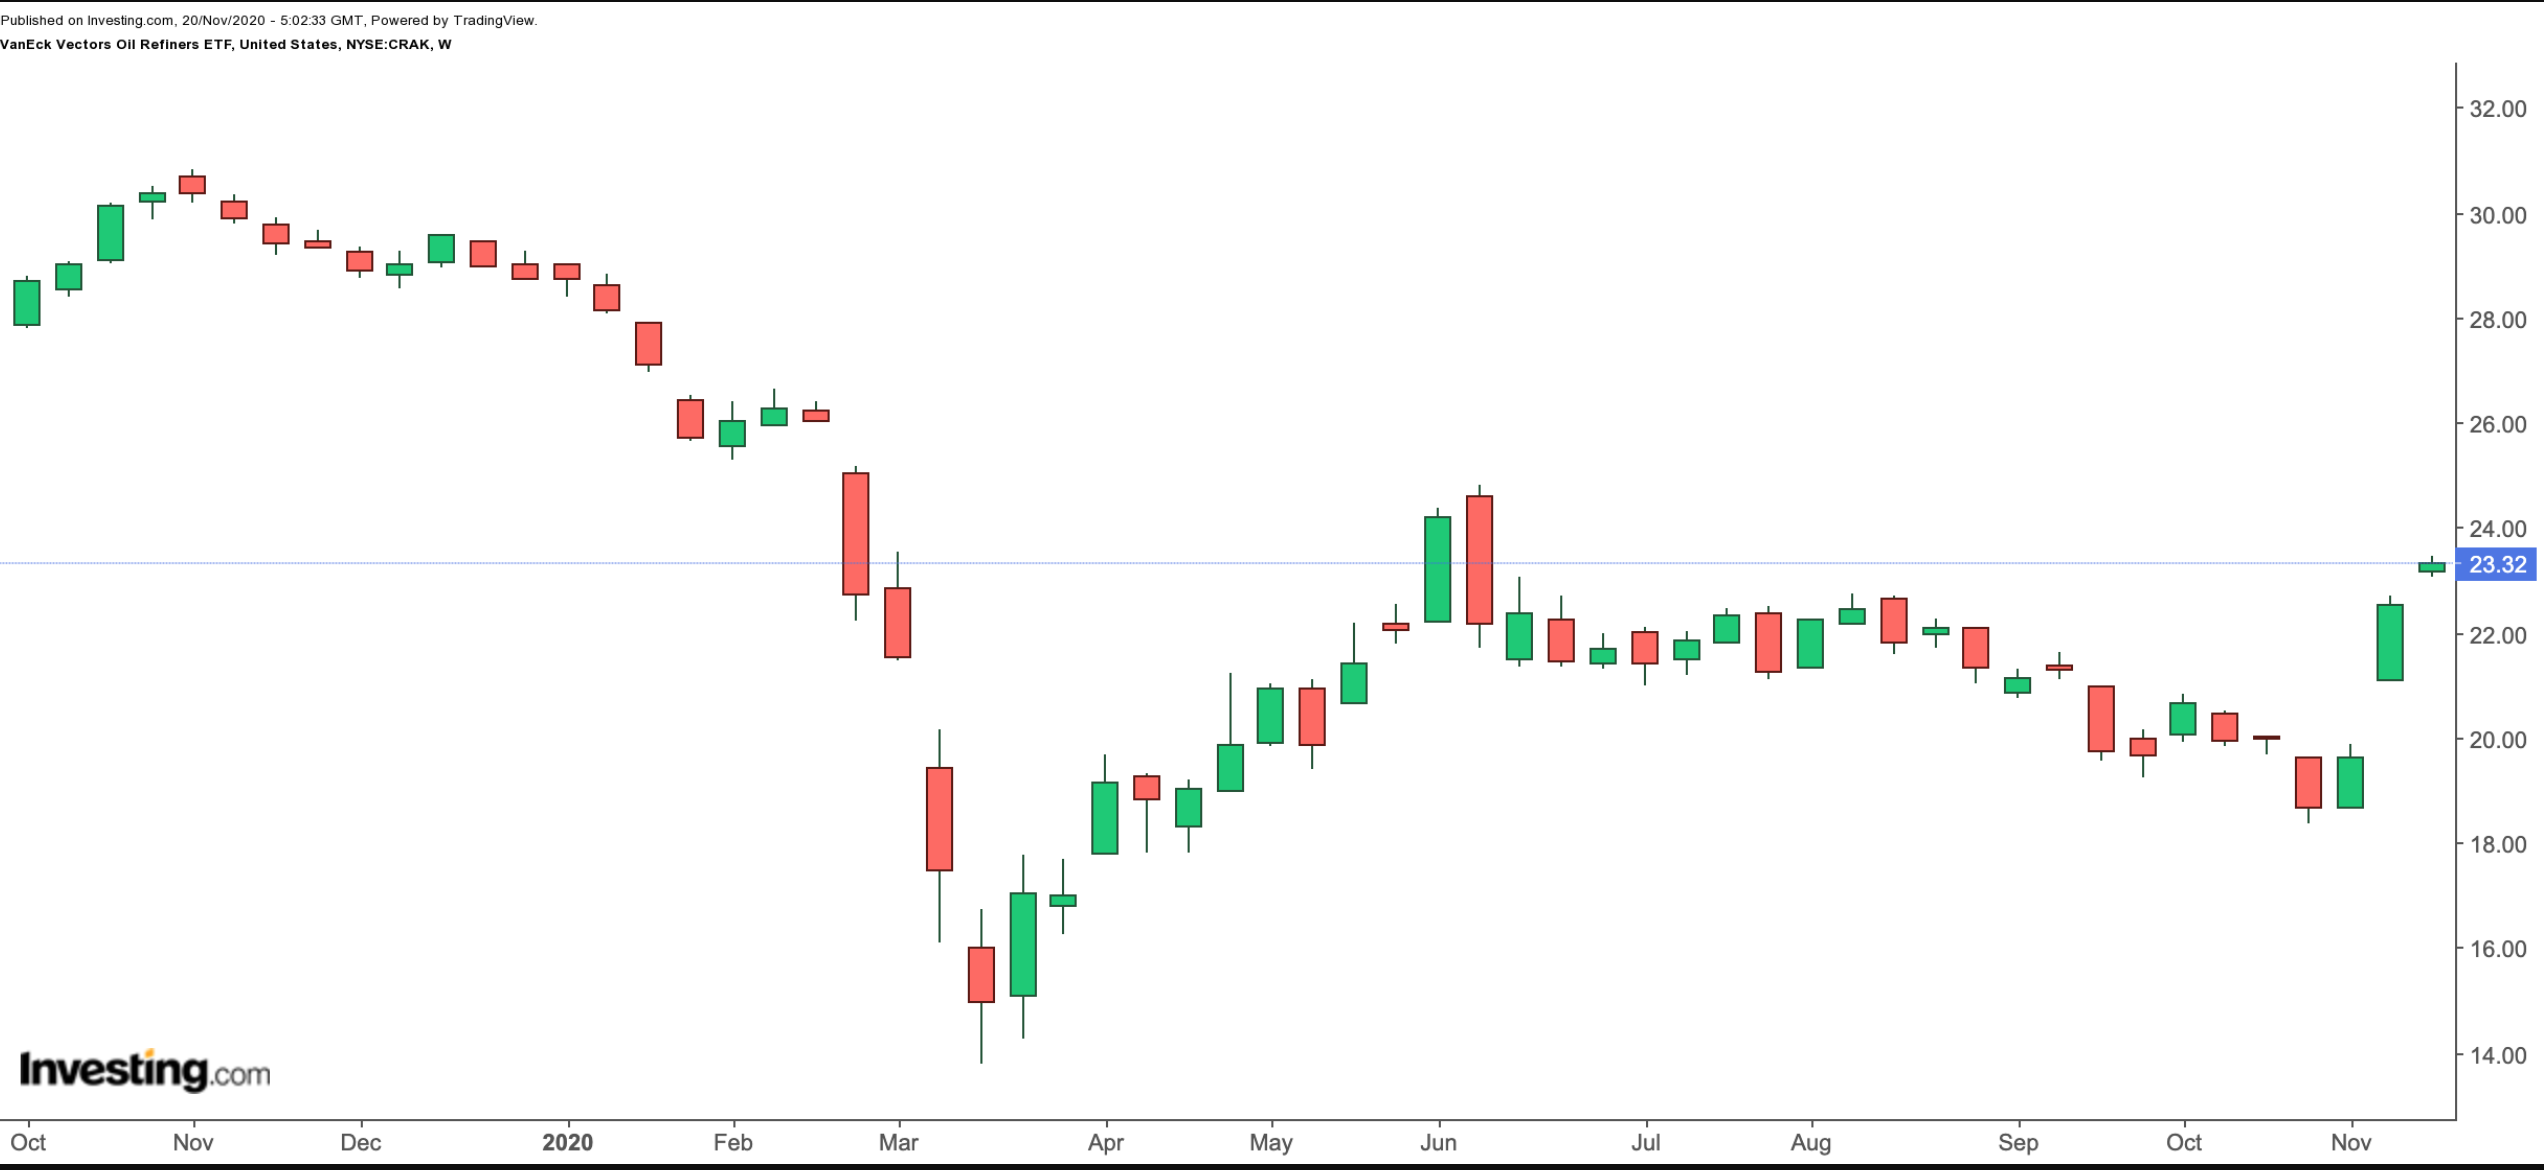
Current Price: $23.33
52-Week Range: $13.80 - $29.91
Dividend Yield: 1.78%
Expense Ratio: 0.60%
The VanEck Vectors Oil Refiners ETF (NYSE:CRAK) gives access to global firms involved in crude oil refining. The fund started trading in 2015.
The name "CRAK" is a reference to refinery "crack spread." According to CME, which operates four exchanges (i.e., CME, CBOT, NYMEX and COMEX):
"Refiners' profits are tied directly to the spread, or difference, between the price of crude oil and the prices of refined products — gasoline and distillates (diesel and jet fuel). This spread is referred to as a crack spread. It is referenced as a crack spread due to the refining process that "cracks" crude oil into its major refined products."

CRAK, which has 25 holdings, tracks the MVIS Global Oil Refiners Index. The top ten businesses make up 61.65% of net assets of $16.2 million. From a geographic point of view, companies from the US head the list with 23.38%. It is followed by Japan (11.88%), Finland (8.75%), India (8.43%), South Korea (8.05) and Australia (5.28%).
Finland-based refiner Neste Oyj (OTC:NTOIY), India-headquartered energy giant Reliance Industries (NS:RELI), Findlay, Ohio-headquartered oil refining and transportation firm Marathon Petroleum (NYSE:MPC), Houston, Texas-based energy manufacturing and logistics group Phillips 66 (NYSE:PSX) and Japanese energy business ENEOS (OTC:JXHLY) are currently the leading names of the ETF.
Since the start of the year, CRAK has fallen by 20%. However, in November, the fund is up about 25%. Investing in CRAK is a bet on the profitability of global refineries in the coming quarters.
