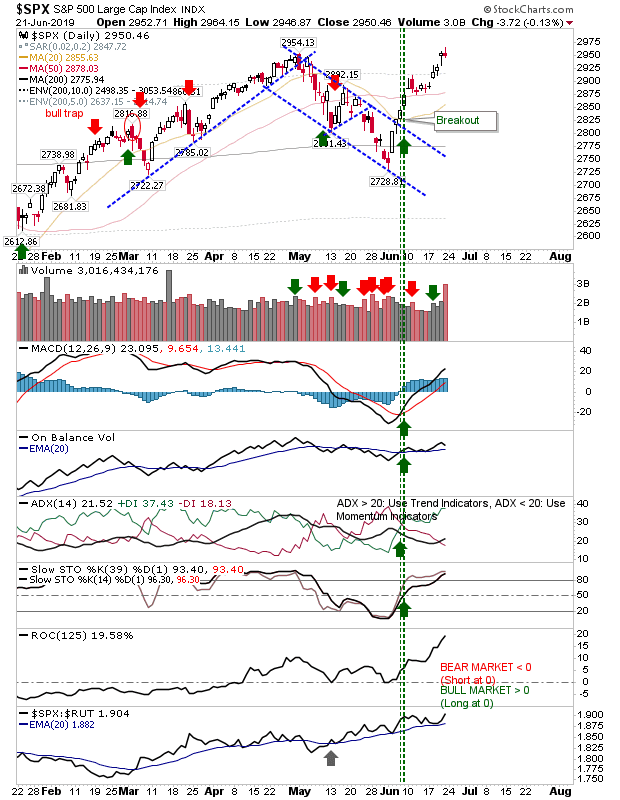
Options expiration skewed volume action on Friday but it was a relatively neutral day. Only the Russell 2000 suggested a more bearish undertone existed in the market.
The S&P is currently probing its April high so it's of no surprise to see a small 'gravestone' doji appear on this test. I would be happy to see a small consolidation handle (ideally holding the 50-day MA) as a preparation for a push to new all-time highs, but don't be surprised if the market doesn't wait for this. This rally has merit with excellent relative performance and an accumulation trend in volume.
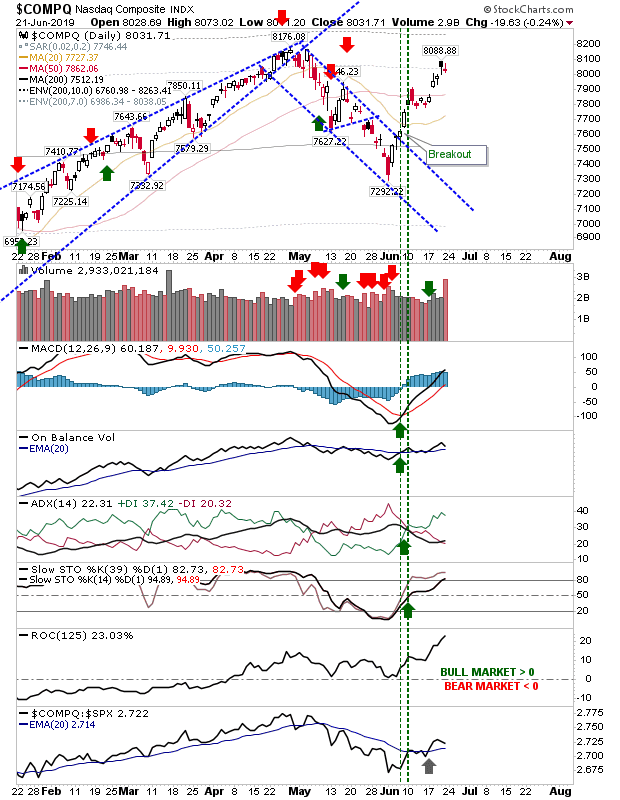
The NASDAQ hasn't yet reached the highs of April, but the May-June move has merits and is likely to result in new all-time highs, even if the current move has to come back a little before it does so. The index has made strong moves in clawing back relative performance against the S&P, and currently leads this index. With the Russell 2000 struggling, I would be looking for this index to lead to new highs.
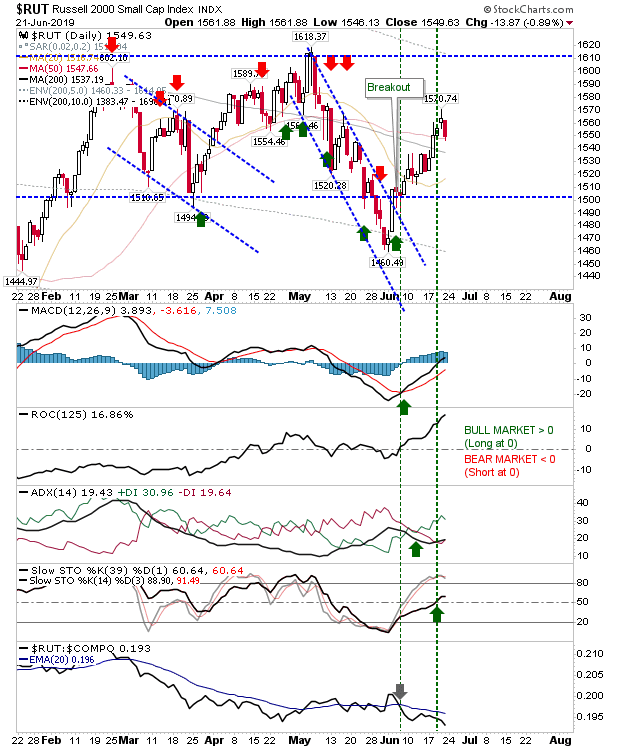
The Russell 2000 gave a much clearer indication of trader intent with a confirmed profit take sell-off. The index is still above 50-day and 200-day MAs and this may only be a small blip in the June rally. The index remains range bound, so I wouldn't be reading too much into a single day's sell-off in the middle of this range. While relative performance is poor, other technicals continue to improve.
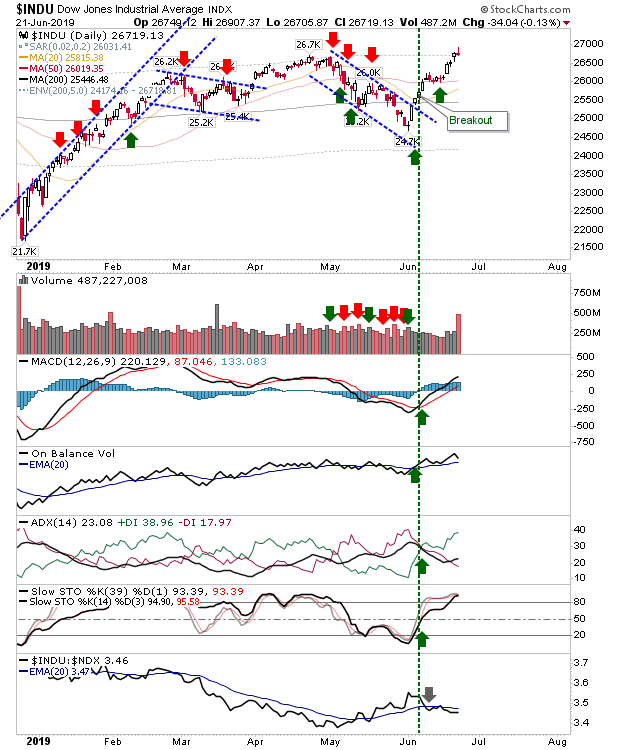
In a somewhat low key exception, the Dow Jones Industrial Average did manage a new all-time high, despite the neutral doji finish. Again, despite Friday's neutral finish I wold view this as a pause in a larger bullish move.
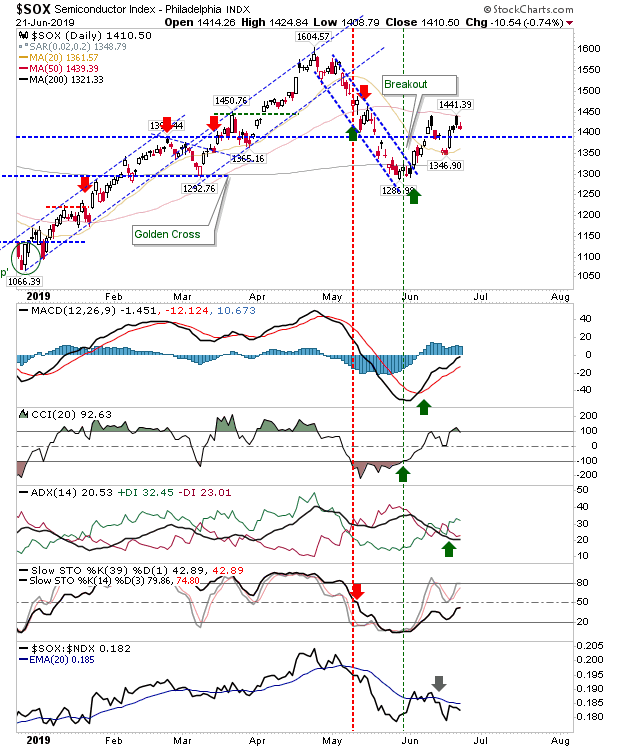
The Semiconductor Index has an unusual double black candlestick pairing at 50-day MA resistance, although with the 200-day MA still available as support, this consolidation squeeze still looks more likely to break upside given the improving technical picture—in particular, a very strong CCI and positive +DI/-DI.
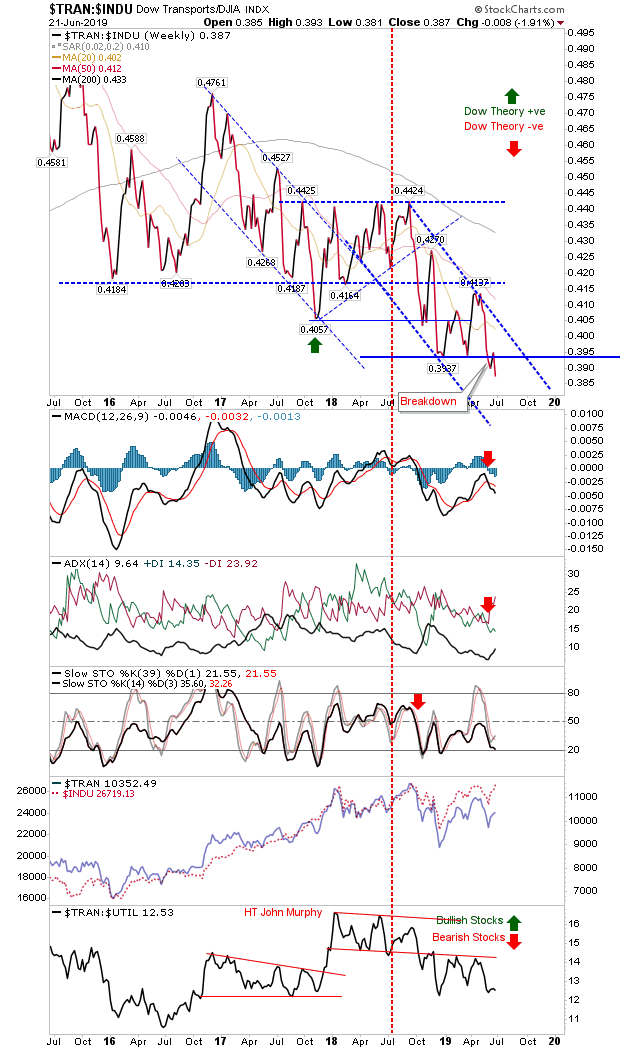
If there is a bearish warning, it's in the relationship between Dow Transports and Dow Industrials; last week saw a support breakdown, within a downward trend started in 2018 (of a much larger trend kicked off in 2015). I'm surprised this hasn't had more influence in the market, but last week's action must be noted. If for no other reason, it's bad news for the economy.
For today, it will be about applying continued pressure on 2019 highs and delivering a solid breakout as Q3 approaches. A consolidation would be the compromise, but only aggressive shorts would be looking to attack Friday's close.
