- A new low leads to a recovery
- New clues from open interest
- Always expect the unexpected in natural gas and you will never be surprised
Last week, in an article for ETF Daily News, I wrote: “Natural Gas could have more room on the upside, given the technical position of the energy commodity.” I wrote that on July 3, when the price of the active month August futures was trading at $1.726 per MMBtu. At the end of this week, gas futures were at the $1.80 level, after trading to a high of $1.924, the highest since early June.
I had pointed out that the rise in the total number of open long and short positions in natural gas from early May through late June, when the price dropped, was a sign that speculative shorts had returned to the market.
They pushed the price to a new and lower twenty-five-year low in late June. While the August contract fell to $1.517, the continuous contract hit $1.4232 per MMBtu. The low in August futures was on two consecutive sessions on June 25 and 26, which formed a double-bottom formation in the futures arena. Since then, the price recovered by almost 19% in the volatile futures market.
The United States Natural Gas Fund (NYSE:UNG) is the ETF product that tracks NYMEX futures price action. The UGAZ and DGAZ ETNs that magnify the moves on the up and downside are highly liquid short-term trading instruments that are extremely popular with market participants looking for price volatility without venturing into the futures arena at NYMEX.
A New Low Leads To Recovery
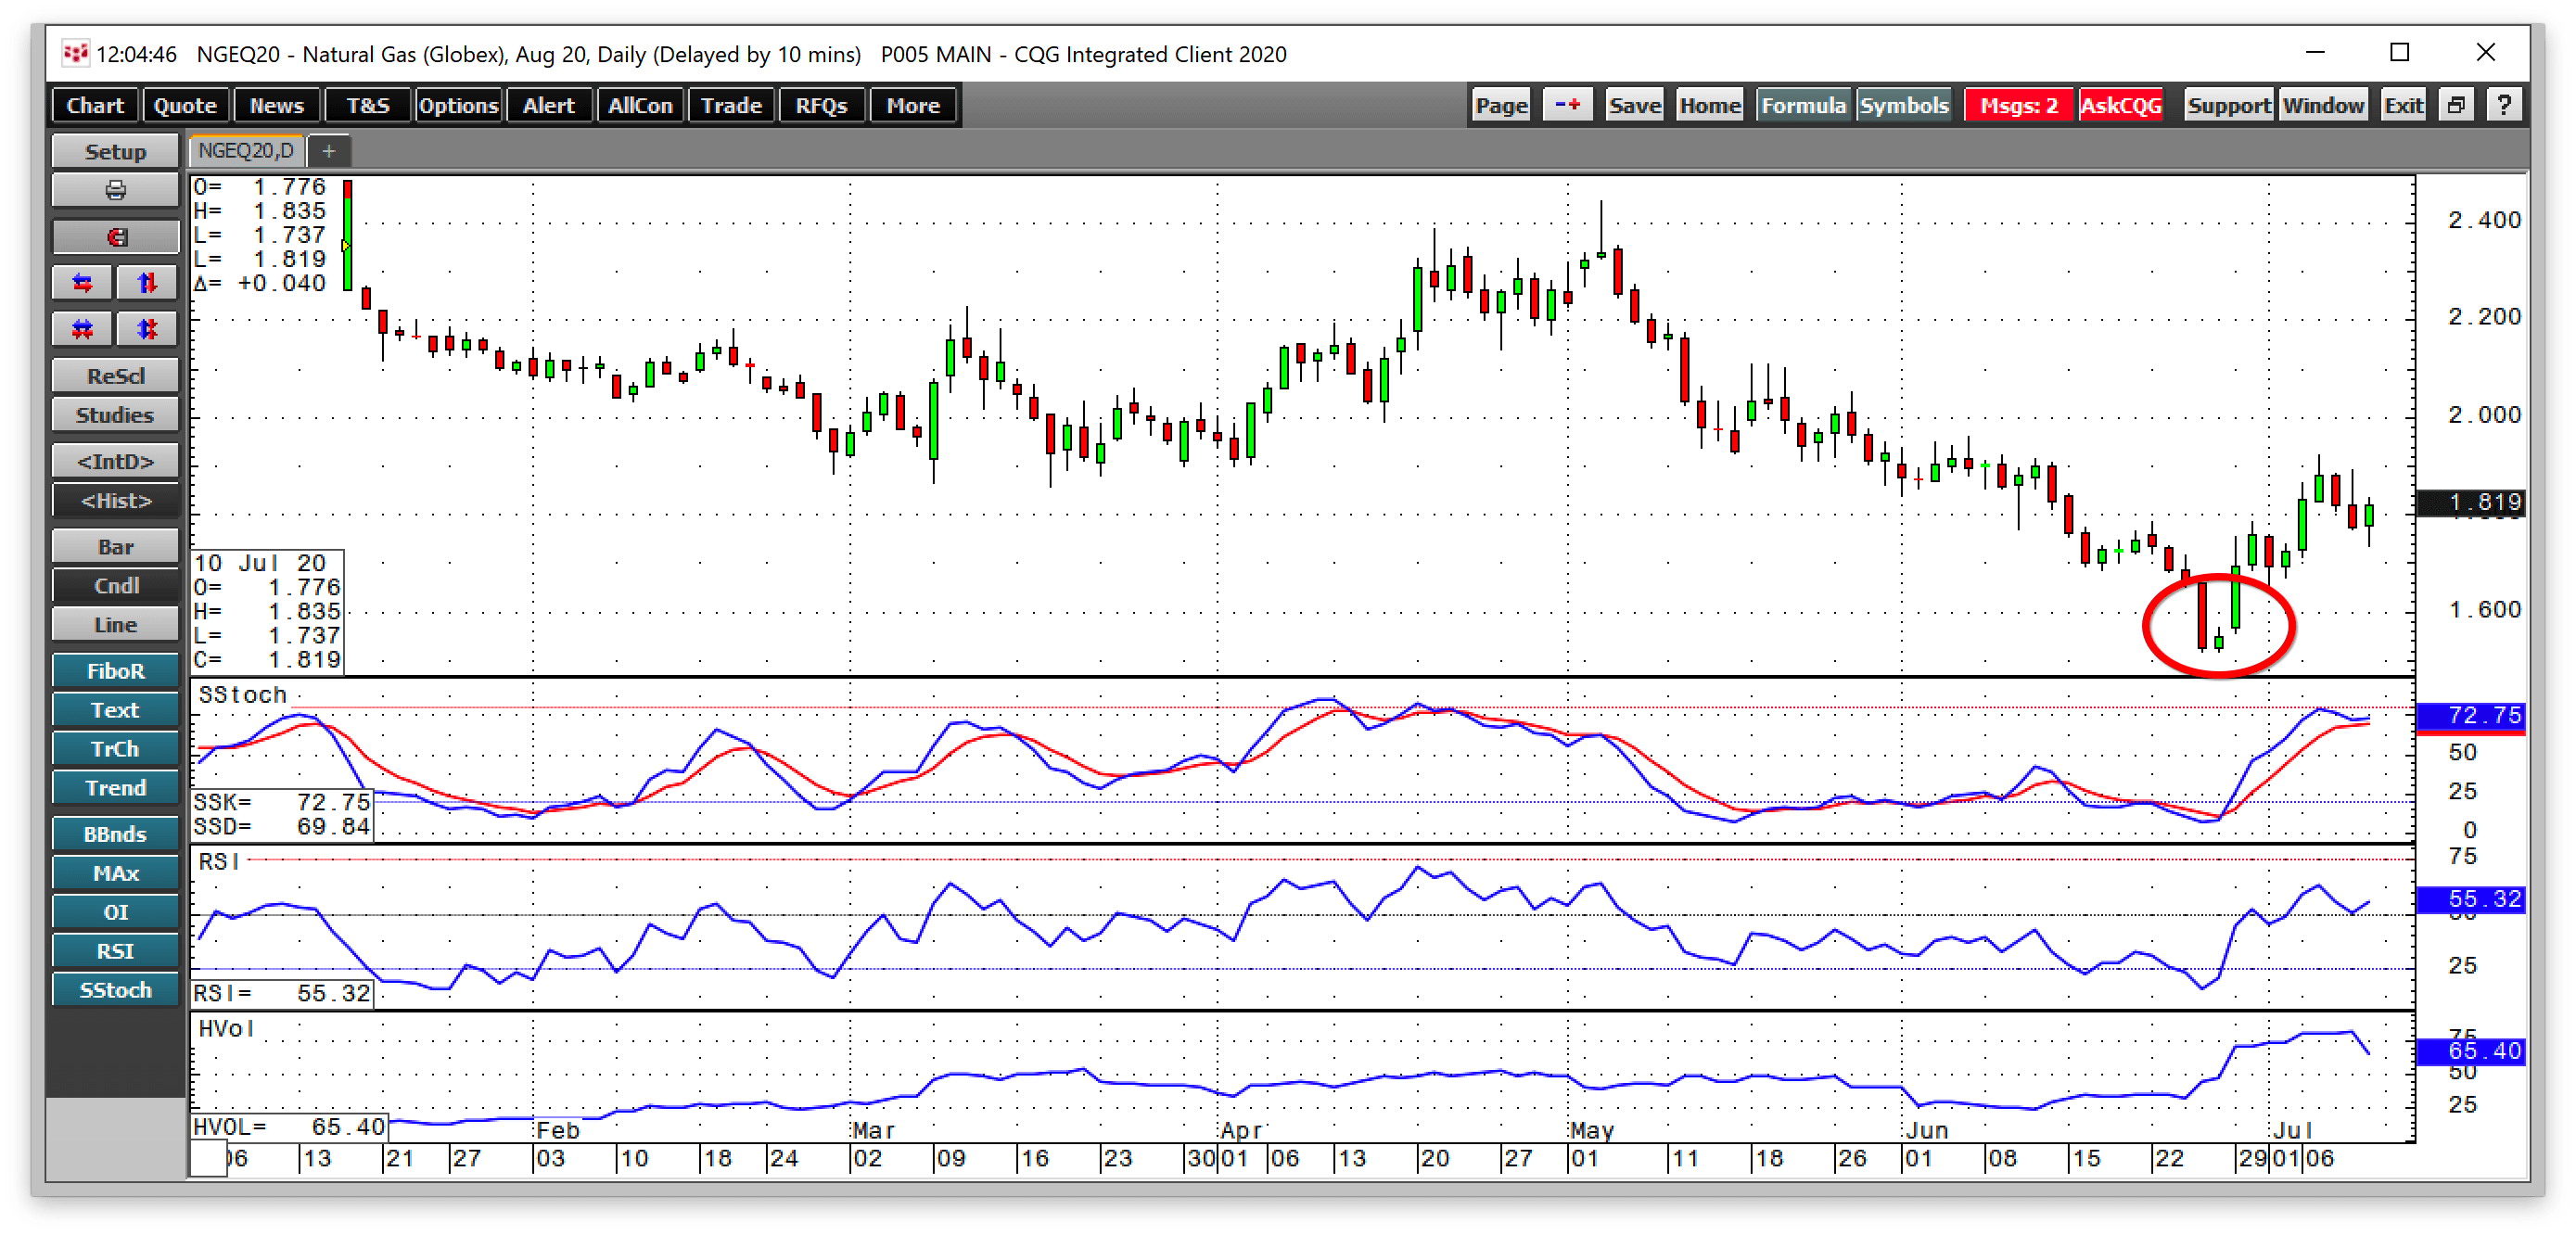
At the end of June, natural gas fell to a low of $1.432, but the active month August contract reached a bottom at $1.517 per MMBtu.

The daily chart shows that the low on June 25 and 26 created a double bottom formation at $1.517 led to a rally that took the price to a high of $1.924 on July 7. Price momentum on the daily chart moved from oversold to overbought territory. The relative strength indicator rose from oversold to above a neutral condition. Daily historical volatility increased from below 33% to over 82% last week.

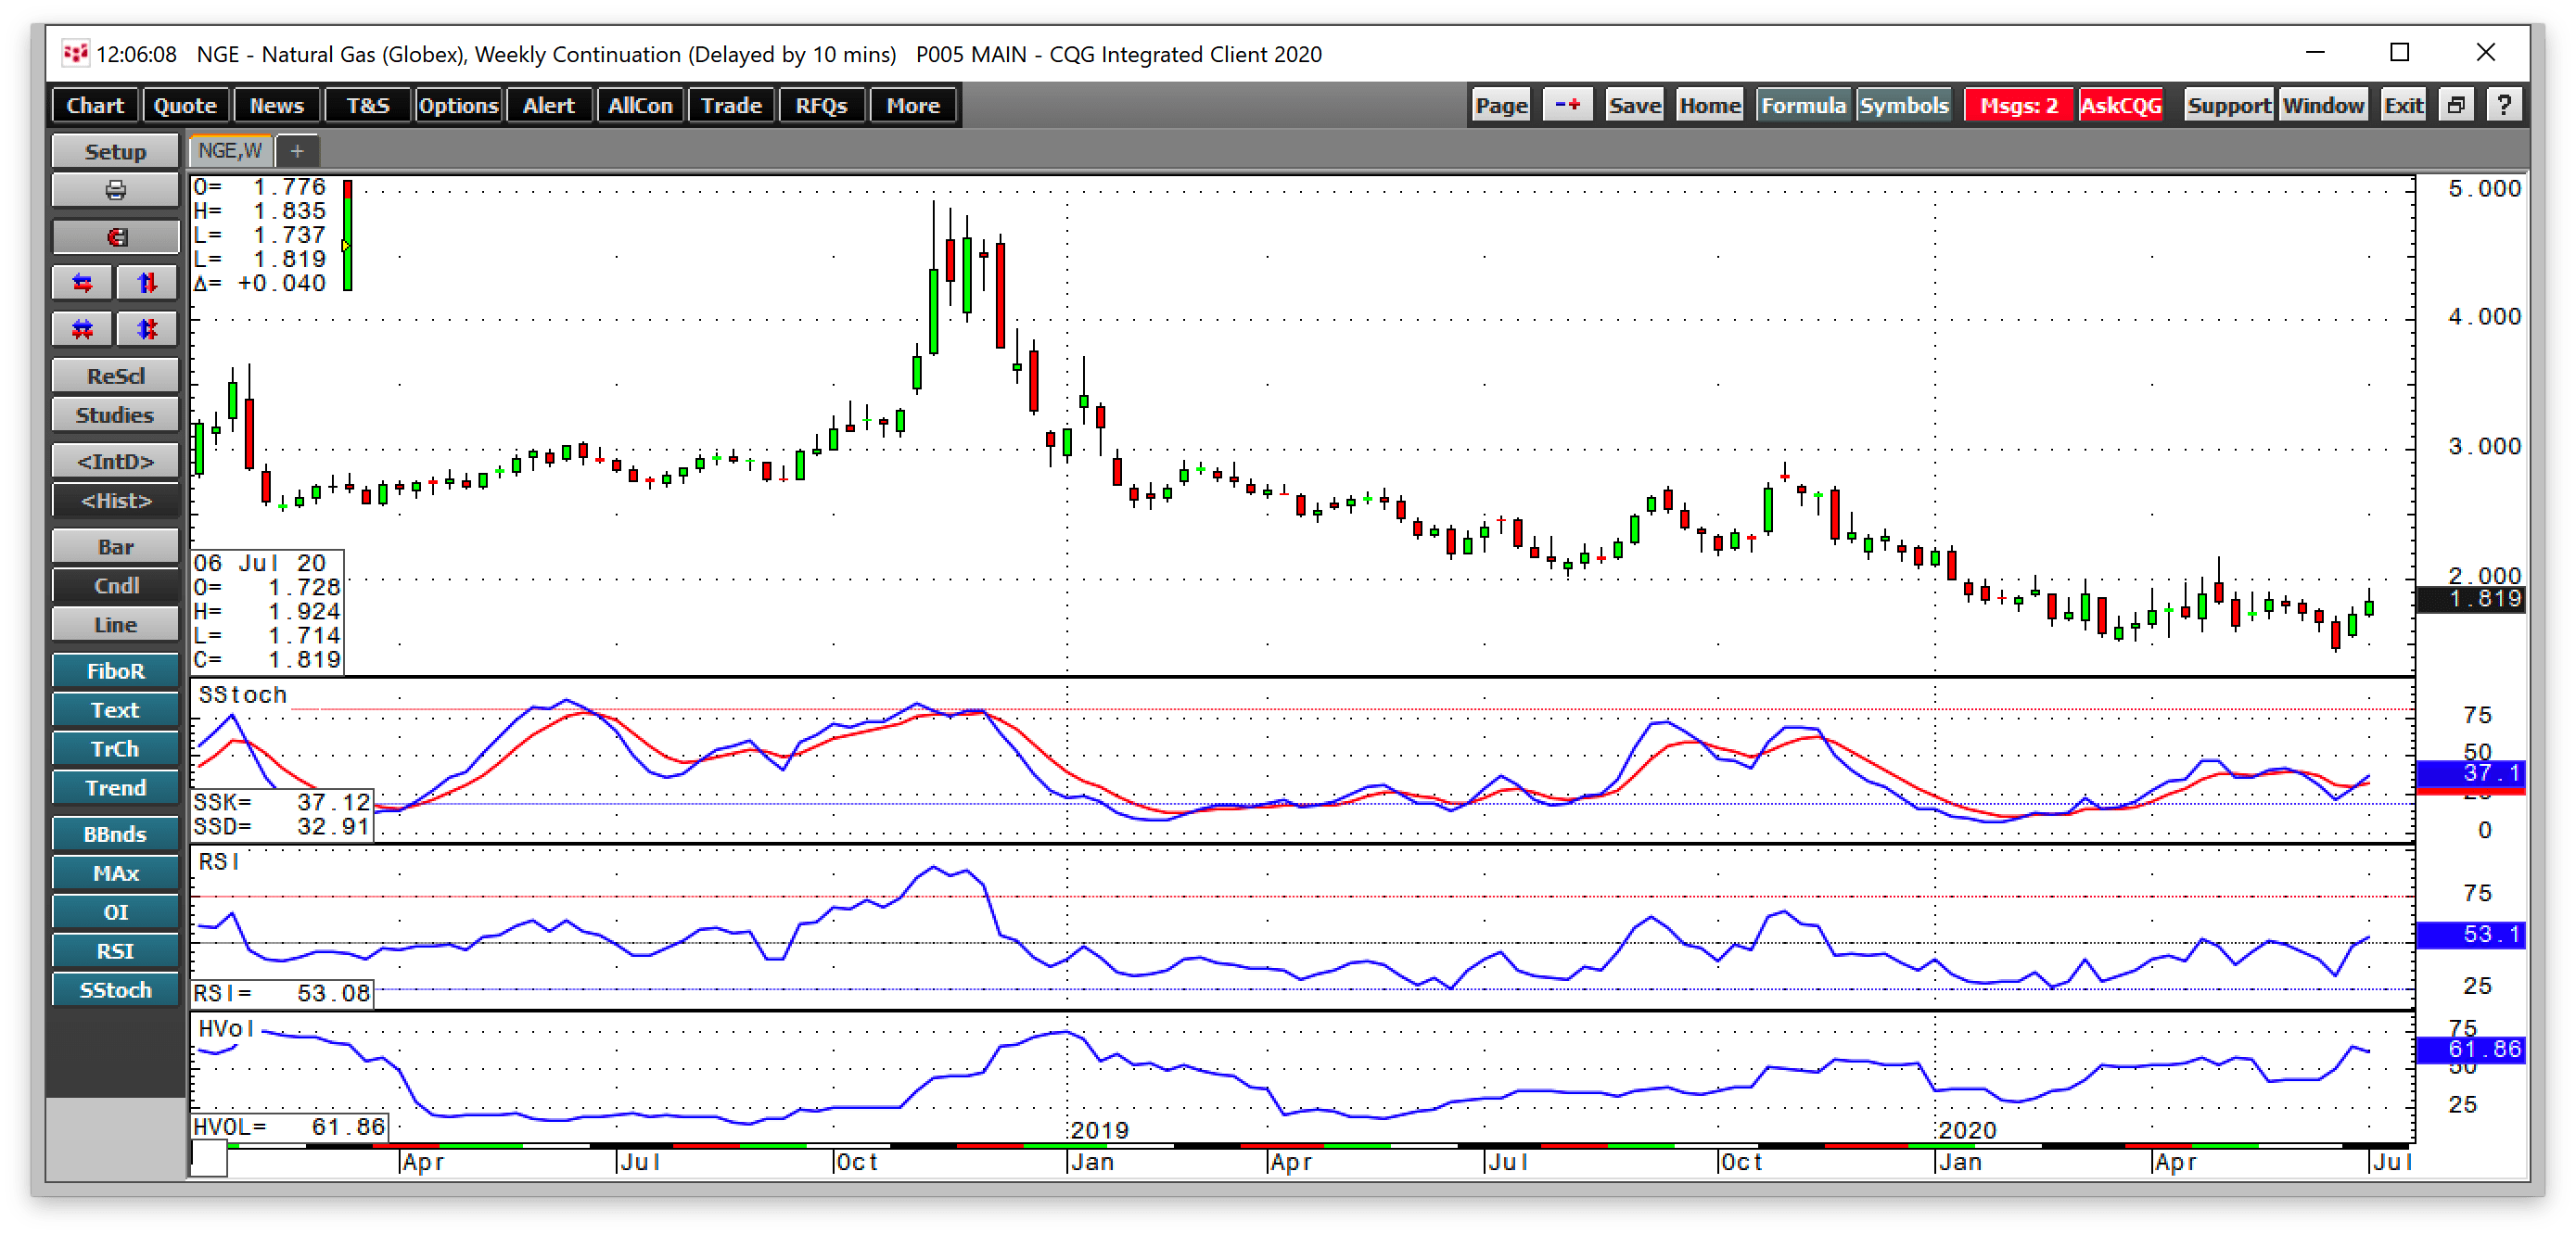
The weekly chart shows that price momentum remains below a neutral reading with relative strength in neutral territory. The level of technical resistance stands at the early May peak at $2.162. A move above that level would be a technical breakout in the natural gas futures market.
New Clues From Open Interest
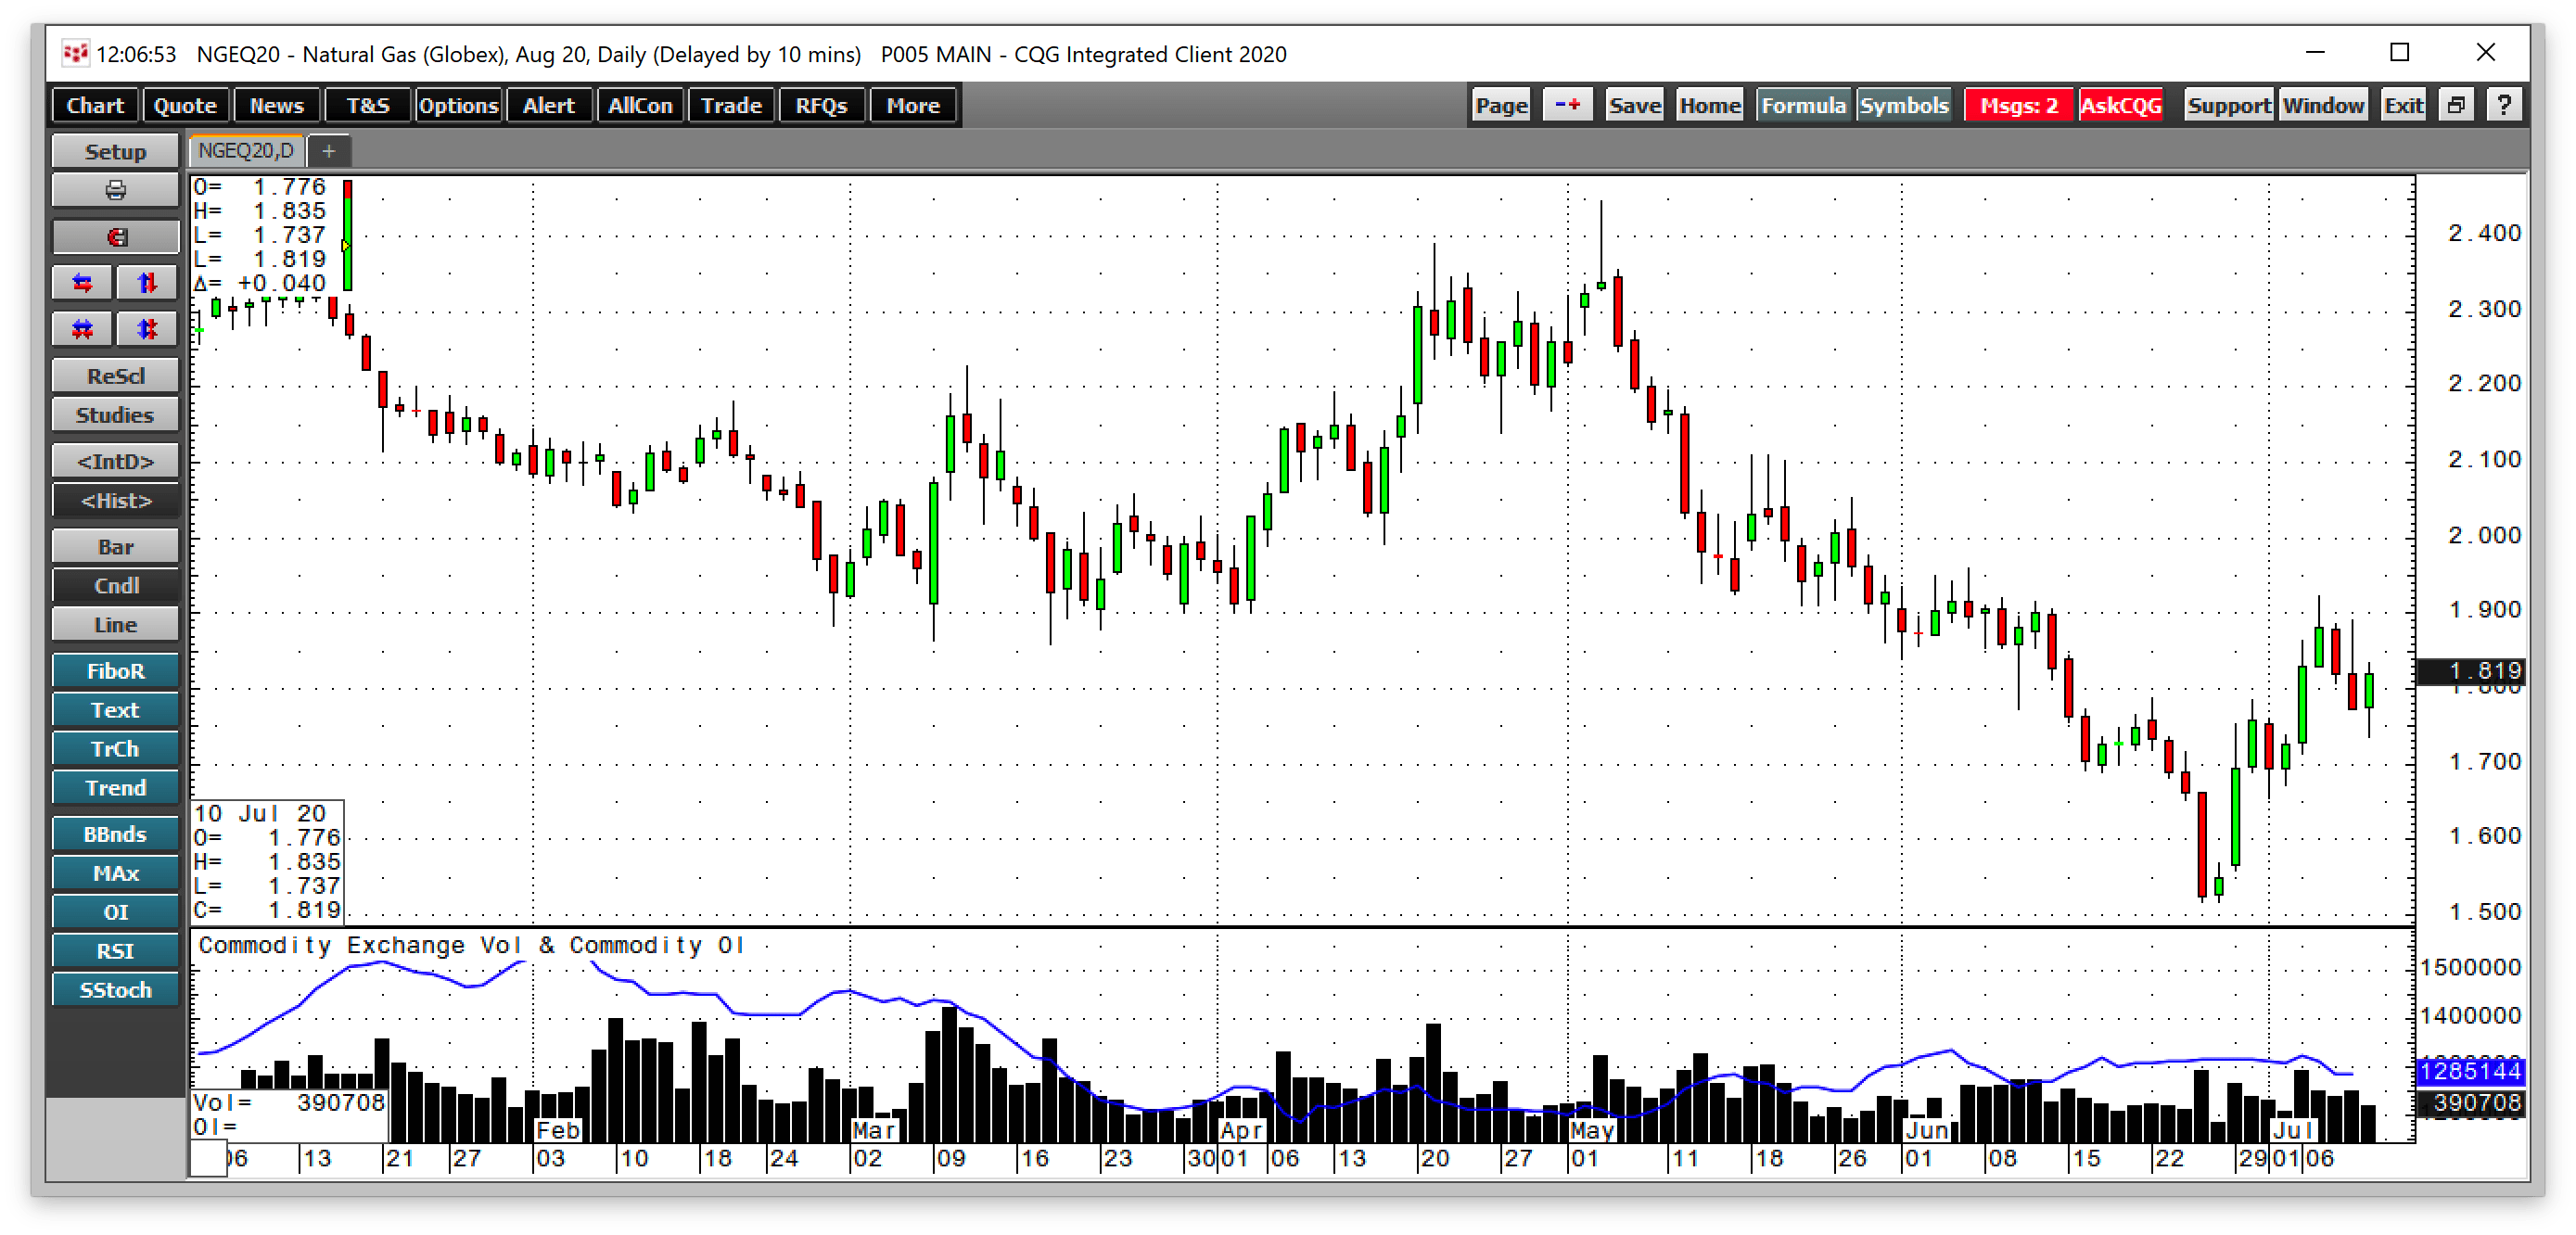
Open interest is the total number of open long and short positions in a futures market.

Source: CQG
The daily chart shows that this metric rose gently as the price fell from early May through late June. Rising open interest and falling prices tend to be a technical validation of a bearish price trend in a futures market. Meanwhile, the metric held steady during the most recent price recovery.
As natural gas corrected from over the $1.90 level to the $1.80 level last week, open interest began to decline. The decline could be a sign that natural gas will find a bottom at a higher level than at the end of June.
Always Expect The Unexpected In Natural Gas
Price variance in the natural gas futures market can be wild at times, so the market attracts a high level of speculative interest. Over the past thirty years, natural gas has traded from a low of $1.02 to a high of $15.65 per MMBtu. Over the recent years, low levels of inventories going into the peak winter season in 2018 took the price from the $2.70 level in July 2018 to a high of $4.929 in November 2018.
Since then, the price made lower highs and lower lows. The most recent peak came last November at $2.905 before the energy commodity fell to a succession of quarter-of-a-century lows in March and June.
The price of natural gas was only 41.2 cents above its thirty-year low in late June. At the $1.80 level at the end of last week, the price is much closer to the lows than the highs. Natural gas is a market that tends to surprise market participants.
When the market becomes over-saturated with bulls or bears, it tends to move in the opposite direction. I continue to favor the long side in the natural gas market over the coming weeks and months. However, I would only buy during periods of price weakness with a tight stop to control the risk.
Natural gas volatility can be legendary at times. As we move through the summer months, the market will focus on the upcoming peak winter season. Seasonality in the natural gas futures market could present some surprises over the coming months. While the price can continue recovering, don’t forget to take profits on rallies as the energy commodity is not likely to repeat its performance from late 2018, given the high level of inventories in 2020.
