
US stock indices got a new impulse to decline on Friday on fears about the viability of Deutsche Bank (ETR:DBKGn). This is the recent momentum of the banking stress we have been in for the last three weeks. The technical signals that the Dow Jones Industrial Average 30 and Nasdaq100 are forming are opposite, which is alarming. Indices cannot go in opposite directions for long, and we must see which trend will prevail.
The momentum of the Nasdaq 100 makes the stress look positive, which can be explained by a sharp shift in expectations of the interest rate hike. At the same time, Dow Jones is full of companies that are less sensitive to a cyclical economic downturn.
Earlier in the week, the Nasdaq100 touched levels of 12900, its highest level since August of last year, while the biggest gain for the Dow was a rebound to its opening levels of March.
By the start of trading on Friday, markets had zeroed in on expectations of further Fed rate hikes, although a month ago, they were confident of a 25–50-point hike without considering other options.
"Bank stress" sent the Dow Jones into an area below its 200-day average and attempts to return higher on Fed comments met with increased selloffs. Short term, this line works as resistance. If the banking sector's problems are not solved at this stage, the index might return relatively quickly to 30700, where the 200-week average is located, but a dive-back below 30,000, last year's low, cannot be ruled out as well.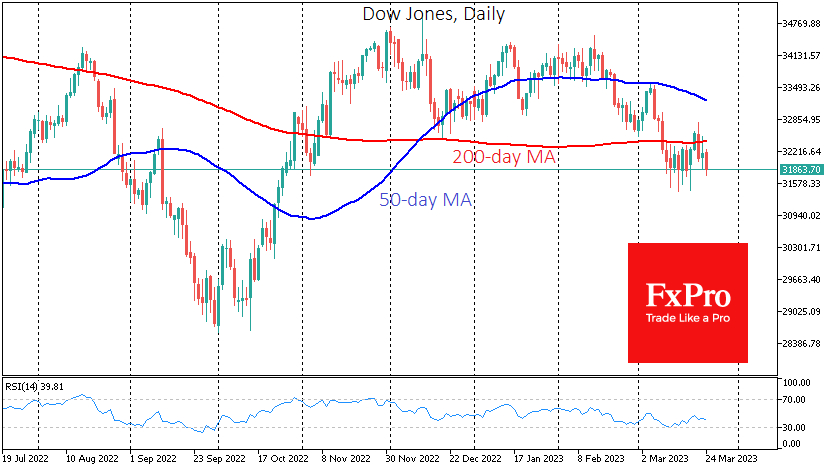
The Nasdaq100, on the other hand, has rallied on the changing outlook for interest rates, experiencing an impressive rally for most of March. The market seems to have lost its upside momentum in the last couple of days, near the 13000 mark and the year's highs, but it still maintains a positive bias. Earlier in March, the indices had a "golden cross" when the 50-day average crossed above the 200-day average. Both curves are now pointing upwards.
In this confrontation between the positive expectations and the severity of the current situation, presented by Nasdaq 100 and the Dow Jones 30 performance, we want to be on the side of realism. In just over a week, the ECB, the Fed, the Banks of England, and Switzerland have all raised rates, further adding to the stress on the financial system.
By urging acceptance of the economic slowdown caused by their actions and despite the pressure on the system, central banks are once again signaling that they are unprepared to unwind policy without visible stress on the broader economy. For financial markets, a rate cut looks like an optimistic scenario with much deeper levels in the stock market indices.
If, however, central bankers are lucky enough to be able to address the situation with banks, the markets will continue their uphill climb. But in that case, the Dow Jones could perform better than the Nasdaq 100.
- English (UK)
- English (India)
- English (Canada)
- English (Australia)
- English (South Africa)
- English (Philippines)
- English (Nigeria)
- Deutsch
- Español (España)
- Español (México)
- Français
- Italiano
- Nederlands
- Português (Portugal)
- Polski
- Português (Brasil)
- Русский
- Türkçe
- العربية
- Ελληνικά
- Svenska
- Suomi
- עברית
- 日本語
- 한국어
- 简体中文
- 繁體中文
- Bahasa Indonesia
- Bahasa Melayu
- ไทย
- Tiếng Việt
- हिंदी
Nasdaq 100 And Dow Jones Diverge
Published 03/24/2023, 10:54 AM
Updated 03/21/2024, 07:45 AM
Nasdaq 100 And Dow Jones Diverge
Latest comments
Loading next article…
Install Our App
Risk Disclosure: Trading in financial instruments and/or cryptocurrencies involves high risks including the risk of losing some, or all, of your investment amount, and may not be suitable for all investors. Prices of cryptocurrencies are extremely volatile and may be affected by external factors such as financial, regulatory or political events. Trading on margin increases the financial risks.
Before deciding to trade in financial instrument or cryptocurrencies you should be fully informed of the risks and costs associated with trading the financial markets, carefully consider your investment objectives, level of experience, and risk appetite, and seek professional advice where needed.
Fusion Media would like to remind you that the data contained in this website is not necessarily real-time nor accurate. The data and prices on the website are not necessarily provided by any market or exchange, but may be provided by market makers, and so prices may not be accurate and may differ from the actual price at any given market, meaning prices are indicative and not appropriate for trading purposes. Fusion Media and any provider of the data contained in this website will not accept liability for any loss or damage as a result of your trading, or your reliance on the information contained within this website.
It is prohibited to use, store, reproduce, display, modify, transmit or distribute the data contained in this website without the explicit prior written permission of Fusion Media and/or the data provider. All intellectual property rights are reserved by the providers and/or the exchange providing the data contained in this website.
Fusion Media may be compensated by the advertisers that appear on the website, based on your interaction with the advertisements or advertisers.
© 2007-2024 - Fusion Media Limited. All Rights Reserved.