Get 40% Off
👀 👁 🧿 All eyes on Biogen, up +4,56% after posting earnings. Our AI picked it in March 2024.
Which stocks will surge next?
Unlock AI-picked Stocks

Money Supply Growth Indicates The U.S. Boom Continues

Published 05/11/2021, 12:16 AM
Updated 07/09/2023, 06:31 AM

The major trends in monetary inflation result in a boom-bust cycle. In particular, a rising trend in the money-supply growth rate leads to increased consumption and investment spending, ushering-in the boom phase of the cycle. A subsequent decline in the rate of money-supply growth reveals the investing errors of the boom and leads to a liquidation process, which is the bust phase of the cycle. In other words, monetary inflation causes the boom and the boom causes the bust.

Once a boom is set in motion by creating lots of money out of nothing, a painful bust that eliminates all or most the boom’s apparent gains is inevitable. The only question is the timing. Even if the central bank tries to keep the boom going forever by maintaining a rapid pace of money-supply growth, all it will do is set the scene for the eventual bust to involve hyperinflation and a total economic breakdown.

Unfortunately, the timing question can’t be answered well in advance of the start of the boom-to-bust transition. However, there are indicators that usually generate warning signals early enough to be useful. Two such signals are credit spreads and the gold/commodity ratio.

When a boom is in progress, credit spreads are relatively narrow or in a narrowing trend and gold is relatively cheap or in a cheapening trend. As evidenced by the following chart, that’s exactly what has been happening over the past 13 months and especially over the past 6 months (the black line on the chart is a credit-spread indicator and the yellow line on the chart is the gold/commodity ratio).

3rd party Ad. Not an offer or recommendation by Investing.com. See disclosure here or remove ads .

Furthermore, although gold has done well in USD terms since late-March and ended last week at a 2-month high, relative to commodities (as represented by the GSCI Spot Commodity Index – GNX) it tested its 12-month low last week. With credit spreads near their narrowest levels in more than 12 months, this makes sense. It means that the US boom is intact.
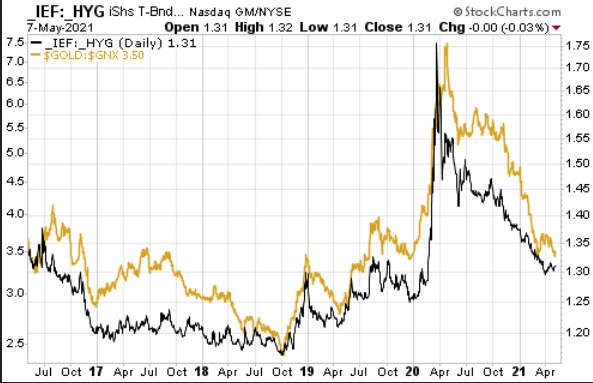
IEF:HYG vs Gold Daily Chart

When the boom is close to its end the gold/commodity ratio should start trending upward and credit spreads should start widening.

Latest comments

I wanna invite sir
If it’s a boom, it’s certainly a fake boom created by zero interest rates, quantitative easing and trillions in stimulus. Remove that and you have the bust.
Thoughts on bust timing?
Within 18 months of the expected end of quantitative easing.(QE). Not later than mid-2024, assuming QE ends or slows significantly this year.
Were all laughing at you .... boom is a fake dud without fed printing 6 trillion more Trump bucks and hading it directly to wallstreet ( if they do that infkation will destroy the economy) .... its over buddy ... next few months
Risk Disclosure: Trading in financial instruments and/or cryptocurrencies involves high risks including the risk of losing some, or all, of your investment amount, and may not be suitable for all investors. Prices of cryptocurrencies are extremely volatile and may be affected by external factors such as financial, regulatory or political events. Trading on margin increases the financial risks.
Before deciding to trade in financial instrument or cryptocurrencies you should be fully informed of the risks and costs associated with trading the financial markets, carefully consider your investment objectives, level of experience, and risk appetite, and seek professional advice where needed.
Fusion Media would like to remind you that the data contained in this website is not necessarily real-time nor accurate. The data and prices on the website are not necessarily provided by any market or exchange, but may be provided by market makers, and so prices may not be accurate and may differ from the actual price at any given market, meaning prices are indicative and not appropriate for trading purposes. Fusion Media and any provider of the data contained in this website will not accept liability for any loss or damage as a result of your trading, or your reliance on the information contained within this website.
It is prohibited to use, store, reproduce, display, modify, transmit or distribute the data contained in this website without the explicit prior written permission of Fusion Media and/or the data provider. All intellectual property rights are reserved by the providers and/or the exchange providing the data contained in this website.
Fusion Media may be compensated by the advertisers that appear on the website, based on your interaction with the advertisements or advertisers.
© 2007-2024 - Fusion Media Limited. All Rights Reserved.