
Most major global stock indices traded in the green yesterday, but this has not changed our view. We still see a negative picture for Asian equities, while we prefer to maintain a flat stance with regards to EU and US shares, due to the looming US employment report on Friday. Among major currencies, the Kiwi was the main gainer as the stellar employment report overnight may have increased the chances for a rate hike by the RBNZ at its upcoming gathering.
Investors Increase Their Risk Exposure, NZD The Main Major FX Gainer
The US dollar traded lower against most of the other major currencies on Tuesday and during the Asian session Wednesday. It eked out some gains only versus CAD and EUR, while it lost the most ground versus NZD.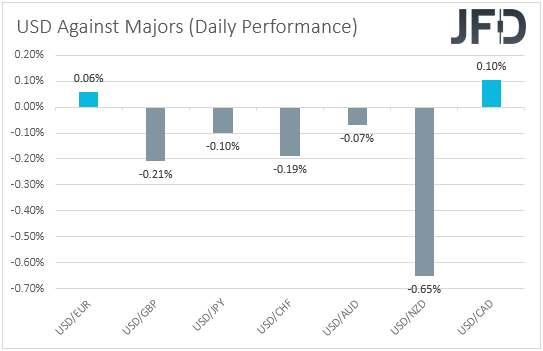
The relative weakness in the US dollar, combined with the strengthening of the risk-linked Kiwi, suggests that markets turned to risk-on trading again at some point yesterday. However, the weakening of the Loonie points otherwise. Thus, in order to get a clearer picture with regards to the broader market sentiment, we prefer to turn our gaze to the equity world. There, most major EU indices traded in the green again, with appetite improving even further during the US and Asian sessions. The only exceptions the German DAX and Japan’s Nikkei 225, which slid 0.09% and 0.22% respectively.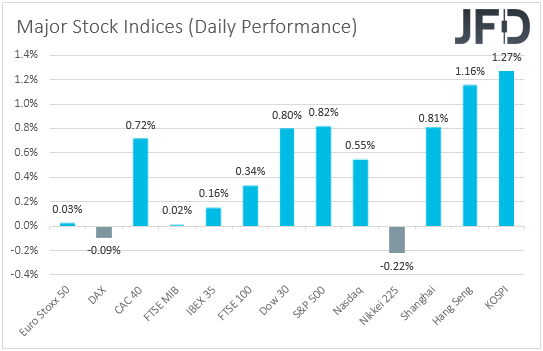
Despite the improvement in investors’ morale, our view has not changed yet. We still believe that the path of least resistance for Asian equities is to the downside as fears over strict regulations in China have not vanished yet, while we prefer to maintain a flat stance with regards to EU and US shares, although from a technical perspective, their broader paths remain to the upside. The reason why we prefer to take the sidelines is the looming US employment report on Friday. As we noted yesterday, expectations are for a strong report, and if the forecasts indeed take flesh, this could undermine Fed Chair Powell’s view that the labor market has still a long way to go and thus, it may revive speculation over early tapering. Yes, a strong labor market could mean that the economic recovery continues at a decent pace, but it could also mean that interest rates could start rising earlier than previously thought. Higher interest rates mean higher borrowing costs for firms, as well as lower present values, and thus, upbeat numbers could weigh on equities.
Now, coming back to the FX sphere, the Kiwi was the main gainer, supported, not only by the rebound in the broader sentiment, but manly by New Zealand’s better than expected employment data for Q2, which was released today, during the early Asian session. The unemployment rate dropped to 4.0% from a downwardly revised 4.6%, instead of just ticking down to 4.5% as the forecast suggested, while both the new added jobs and the labor costs index accelerated by more than expected. At its latest meeting, the RBNZ kept interest rates unchanged at +0.25%, with the language in the accompanying statement being more hawkish than expected, which raised speculation that this Bank may push the hike button even as soon as this month. Thus, the strong jobs numbers may have increased drastically the probability for a rate-hike at the Bank’s upcoming gathering, and that’s why the Kiwi surged in the aftermath of the release.
NASDAQ 100 Technical Outlook
The NASDAQ 100 cash index traded higher yesterday, after it hit support at the upside support line drawn from the low of May 19. Although this means that the broader path remains positive, in the short run, the index has been trading in a trendless mode since July 26, when it hit its record high of 15142.20. With that in mind, and also taking into account that the US jobs report is looming, we prefer to stay sidelined for now.
In order to get confident on the upside again, we would like to see a break above that record peak. However, before that happens, we cannot rule out another retreat and another test near the aforementioned upside support line. In any case, a break above 15142.20 would confirm a forthcoming higher high and take the price into the uncharted territory. With no prior highs and inside swing lows to mark the next potential resistance area, we prefer to mark the round figure of 15500.
Now, in order to start examining the bearish case, we prefer to wait for a dip below 14780, marked by the low of July 27. This could also confirm the break below the aforementioned upside support line and may initially pave the way towards the low of July 8, at 14550, or the low of July 19, at 14450. If neither barrier is able to stop the decline, then we could experience extensions towards the inside swing high of June 18, at 14210.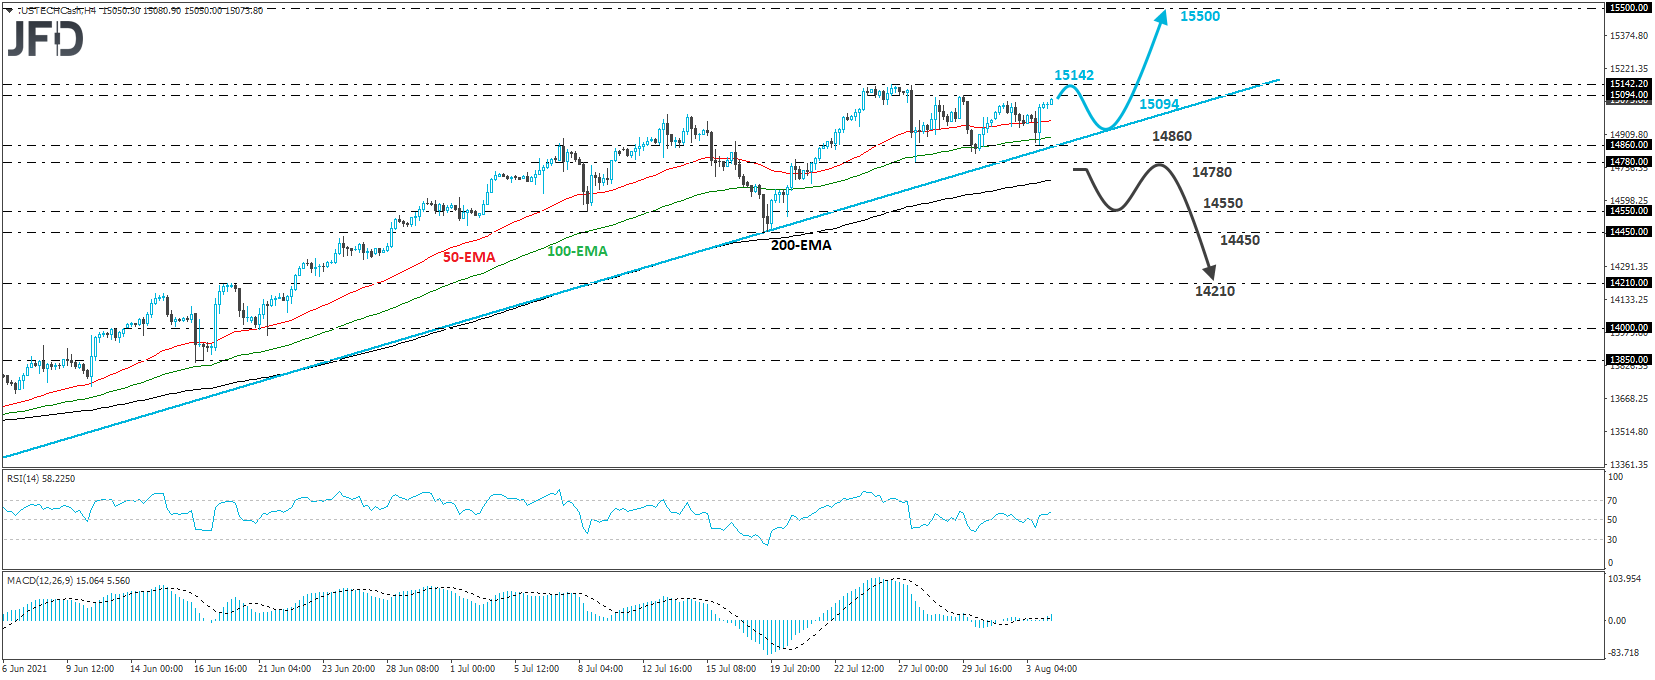
NZD/JPY Technical Outlook
NZD/JPY edged north yesterday, breaking above the downside resistance line taken from the high of May 27. This may have added a positive touch to the short-term picture, but in our view, it has not turned bullish yet. After all, we saw the rate emerging above that line again back on July 6, but returning back below it soon thereafter. Thus, we prefer to wait for a break above the key resistance of 77.30.
That barrier stopped the pair from moving higher between July 23 and 27, and its break could signal a change in the short-term trend. The bulls may initially target the 77.65 obstacle, defined as a resistance by the high of July 14, the break of which could extend the recovery towards the peak of July 7, at 78.10.
On the downside, a dip below 76.05 would confirm a forthcoming lower low and may signal the resumption of the prior downtrend. The first level to consider after such a move could be the low of July 21, at 75.75, the break of which could trigger extensions towards the low of July 20, at around 75.25. If the bears are not willing to stop there, then we could see them aiming for the 74.90 zone, marked by the low of Jan. 31.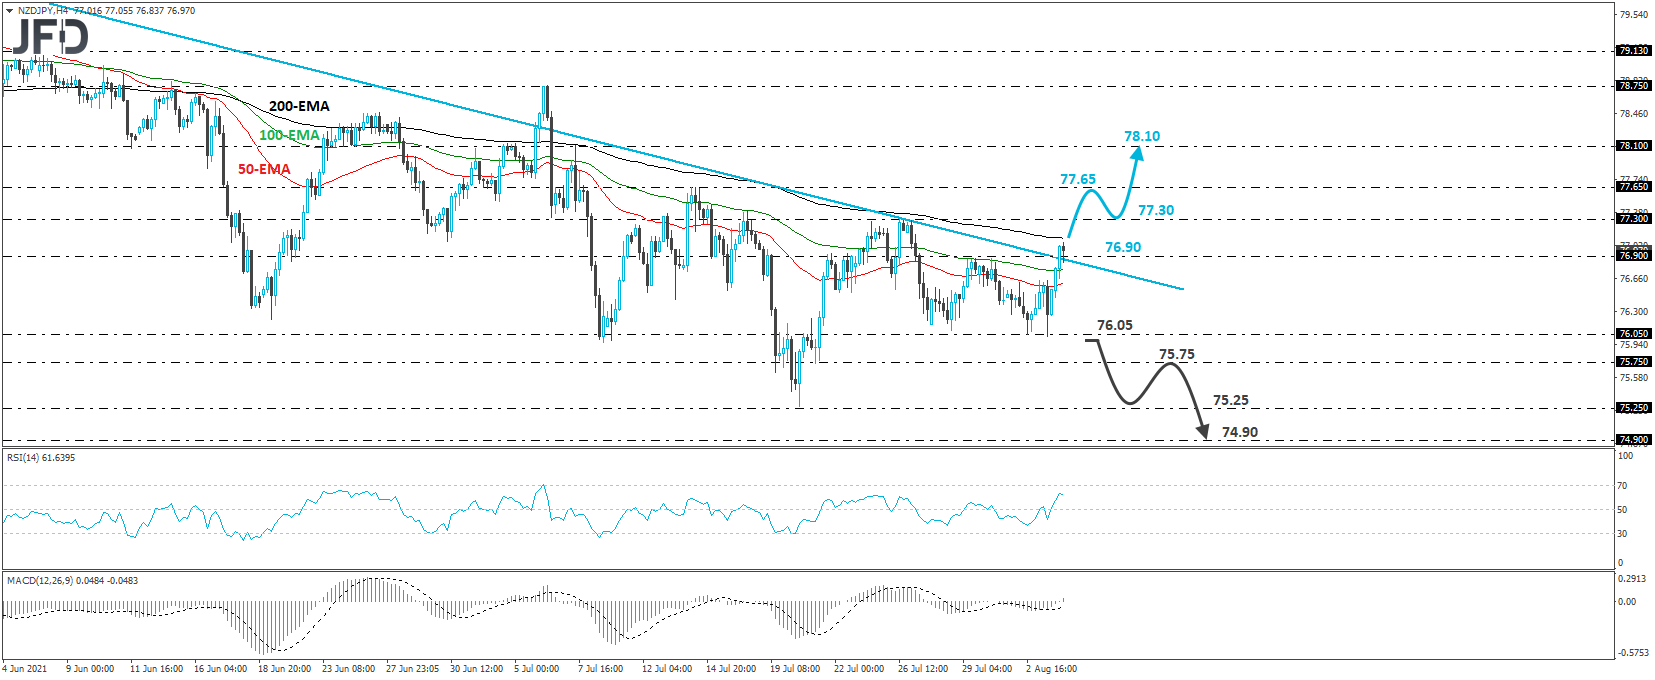
As For The Rest Of Today's Events
Today, we have the final Markit services and composite PMIs for July from the EU, the UK, and the US, the ISM non-manufacturing PMI for the same month, and the ADP employment report for July. The final Markit prints are expected to confirm their preliminary estimates, while the ISM non-manufacturing PMI is anticipated to have inched up to 60.4 from 60.1. As for the ADP report, it is expected to show that the private sector has gained 700k jobs, slightly more than June’s 692k. This could raise speculation that the NFPs, due out on Friday, may also exceed somewhat their June print.
During the Asian session Thursday, Australia’s trade balance for June is coming out, with the nation’s surplus expected to have increased by nearly a billion Aussies.